USD/JPY Price Analysis: Tumbles below 161.00 on back-to-back bearish days
- USD/JPY drops for the second day amid signs of a weakening US labor market.
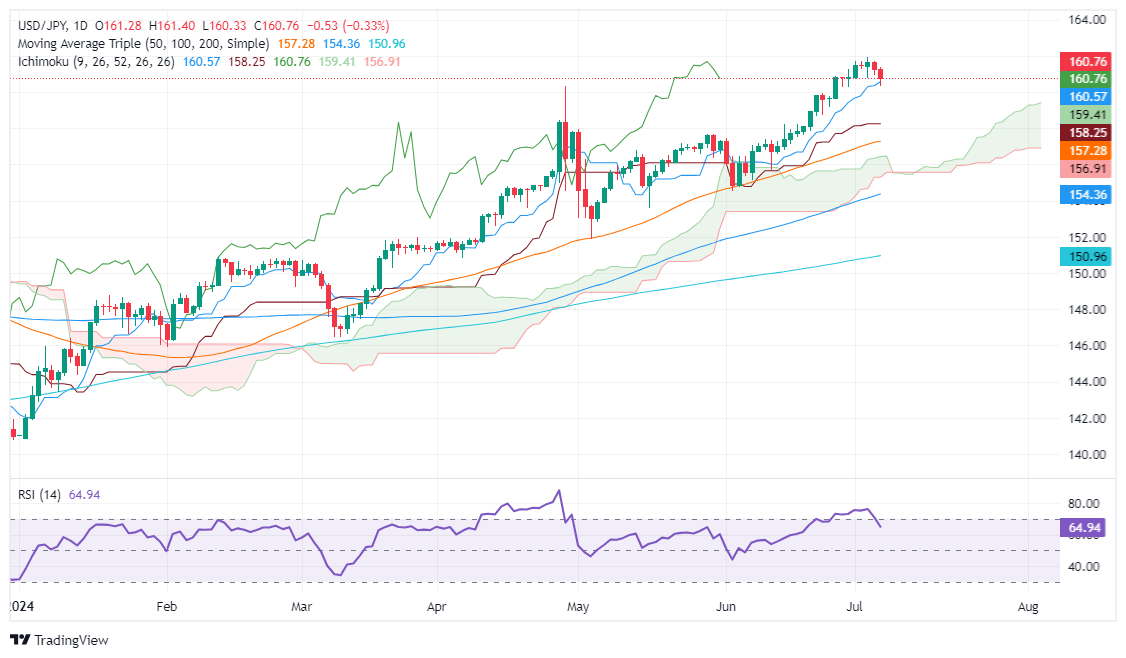
- For bullish momentum, USD/JPY needs to surpass 161.00, facing resistance at 161.70 (July 4 high), 161.95 (YTD high), and 162.00.
- Key support at 160.35 (Tenkan-Sen), 159.30 (Senkou Span A), and 158.25 (Kijun-Sen), marking possible pullback points.

The USD/JPY extended its losses to two consecutive days on Friday, as the US economy showed signs of weakness in the labor market, following a mixed US Nonfarm Payrolls report. Therefore, the pair trades at 160.72 and is down 0.34%.
USD/JPY Price Analysis: Technical outlook
The USD/JPY four-day rally stalled on Thursday, with sellers stepping in and driving the exchange rate below the 161.00 psychological level. This formed a doji in the weekly chart, hinting that higher prices could be difficult to achieve.
Given the backdrop, the pair must clear 161.00 for a bullish continuation. Once cleared, the next stop would be the July 4 high of 161.70 before testing the year-to-date (YTD) high of 161.95. Overhead resistance lies ahead, with 162.00 being the next ceiling level, before the pair aims toward the November 1986 high of 164.87.
Once the USD/JPY dropped below 161.00, the next stop would be the Tenkan-Sen at 160.35. A breach of the latter can exacerbate a pullback toward the Senkou Span A at 159.30, followed by the Kijun-Sen at 158.25.
USD/JPY Price Action – Daily Chart
Japanese Yen PRICE Today
The table below shows the percentage change of Japanese Yen (JPY) against listed major currencies today. Japanese Yen was the strongest against the Canadian Dollar.
| USD | EUR | GBP | JPY | CAD | AUD | NZD | CHF | |
|---|---|---|---|---|---|---|---|---|
| USD | -0.27% | -0.44% | -0.32% | 0.15% | -0.39% | -0.52% | -0.46% | |
| EUR | 0.27% | -0.18% | -0.03% | 0.44% | -0.12% | -0.24% | -0.21% | |
| GBP | 0.44% | 0.18% | 0.14% | 0.62% | 0.07% | -0.07% | -0.05% | |
| JPY | 0.32% | 0.03% | -0.14% | 0.47% | -0.06% | -0.21% | -0.17% | |
| CAD | -0.15% | -0.44% | -0.62% | -0.47% | -0.56% | -0.68% | -0.66% | |
| AUD | 0.39% | 0.12% | -0.07% | 0.06% | 0.56% | -0.13% | -0.07% | |
| NZD | 0.52% | 0.24% | 0.07% | 0.21% | 0.68% | 0.13% | 0.02% | |
| CHF | 0.46% | 0.21% | 0.05% | 0.17% | 0.66% | 0.07% | -0.02% |
The heat map shows percentage changes of major currencies against each other. The base currency is picked from the left column, while the quote currency is picked from the top row. For example, if you pick the Japanese Yen from the left column and move along the horizontal line to the US Dollar, the percentage change displayed in the box will represent JPY (base)/USD (quote).
Author

Christian Borjon Valencia
FXStreet
Markets analyst, news editor, and trading instructor with over 14 years of experience across FX, commodities, US equity indices, and global macro markets.


