|

USD/JPY Price Analysis: Tumbles below 135.00, slumps below the 20 and 100-day EMA

  • USD/JPY slides 0.73% after three days of bullish action as US inflation cools down.
  • The pair drops below key daily moving averages, signaling the potential for further downside.

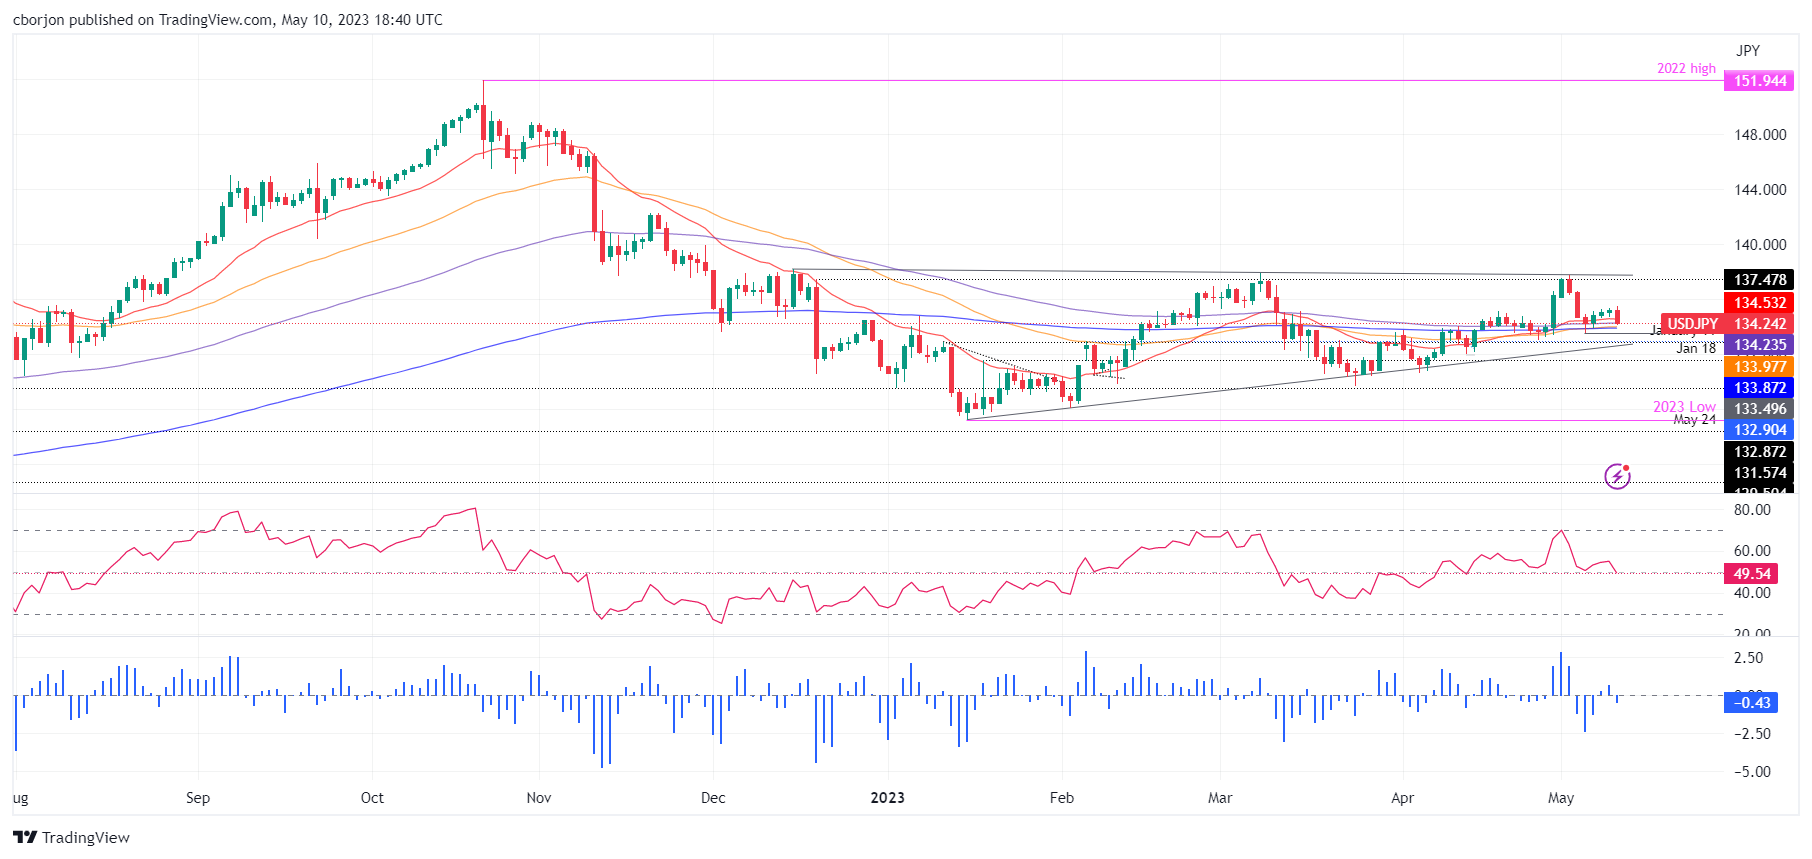
The USD/JPY snaps three days of gains, slides below the 135.00 figure, and distanced from the 20 and 100-day Exponential Moving Average (EMA) at 134.53 and 134.24, respectively, after US inflation cooled down. The fall of the US 10-year Treasury bond yield weighed on the USD/JPY pair due to its close correlation. At the time of writing, the USD/JPY is trading at 134.22, down 0.73%.

USD/JPY Price Analysis: Technical outlook

Given that the USD/JPY dropped below crucial daily moving averages, the USD/JPY bias shifted neutral. On its way south, the USD/JPY pair fell below dynamic support levels, like the 20 and 100-day EMAs, opening the door to test the 134.00 psychological price level.

If USD/JPY breaks below the latter, the USD/JPY pair would challenge the 50-day EMA at 133.97 before testing the 200-day EMA at 133.87. A breach of the latter will expose the May 4 swing low of 133.49.

Conversely, if USD/JPY reclaims the 20-day EMA at 134.53, the next resistance would be the 135.00 figure, followed by the May 10 high of 135.47. Once cleared, the next demand area would be the May 2 high at 137.77.

Oscillators turned bearish, as the Relative Strength Index (RSI) indicator crossed below the 50-mid line, while the 3-day Rate of Change (RoC) records negative readings.

Trend: Below 135.00, further downside expected.

USD/JPY Price Chart – Daily chart

USD/JPY Daily Chart

USD/JPY

Overview
Today last price134.28
Today Daily Change-0.91
Today Daily Change %-0.67
Today daily open135.19
 
Trends
Daily SMA20134.56
Daily SMA50133.84
Daily SMA100132.85
Daily SMA200137.02
 
Levels
Previous Daily High135.36
Previous Daily Low134.72
Previous Weekly High137.78
Previous Weekly Low133.5
Previous Monthly High136.56
Previous Monthly Low130.63
Daily Fibonacci 38.2%135.12
Daily Fibonacci 61.8%134.97
Daily Pivot Point S1134.82
Daily Pivot Point S2134.45
Daily Pivot Point S3134.18
Daily Pivot Point R1135.46
Daily Pivot Point R2135.73
Daily Pivot Point R3136.1

Author

Christian Borjon Valencia

Markets analyst, news editor, and trading instructor with over 14 years of experience across FX, commodities, US equity indices, and global macro markets.

More from Christian Borjon Valencia
Share:

Editor's Picks

EUR/USD flirts with weekly lows near 1.1770

EUR/USD now comes under further selling pressure, breaking below the 1.1800 support to challenge the area of weekly throughs near 1.1770 on Thursday. The pair’s decline comes in response to marked gains in the US Dollar amid steady geopolitical tensions. Ealier in the day, the ECB’s Lagarde delivered cautious remarks, although the currency remained apathetic.

GBP/USD threatens the 200-day SMA near 1.3440

GBP/USD rapidly leaves behind Wednesday’s strong advance, coming under heavy pressure and retesting the 1.3440 zone, where the critical 200-day SMA is located. Cable’s deep pullback follows the strong gains in the Greenback, while investors continue to pencil in a potential BoE rate cut in March.

Gold trims gains, slips back to around $5,170

Gold is now facing some downside pressure, hovering around the $5,170 region on Thursday. The yellow metal surrenders part of its earlier gains on the back of the resurgence of the buying interest in the Greenback. In the meantime, geopolitical tensions in the Middle East continue to limit the downside potential for now.

Stellar: Relief bounce fades as bearish undertone persists

Stellar is trading around $0.16 at the time of writing on Thursday after rebounding more than 8% in the previous day. Derivatives data paints a negative picture as XLM’s short bets hit a monthly high while Open Interest continues to decline.

Changing the game: International implications of recent tariff developments

The Supreme Court ruling on International Emergency Economic Powers Act (IEEPA) tariffs provides limited relief for the rest of the world, with weighted average tariff rates modestly lower.

Bitcoin steadies as traders eye US–Iran talks

Bitcoin (BTC) price is stabilizing around $68,000 at the time of writing on Thursday after a 6.2% relief rally the previous day amid a broader downward trend.