|

USD/JPY Price Analysis: Triple top emerges in the one-hour chart, targets 143.30

  • USD/JPY stumbles below the 144.00 figure due to US bond yields dropping.
  • A triple top in the USD/JPY one-hour chart exerted downward pressure on the major, which cleared the 20 and 50-EMAs.
  • The USD/JPY triple top targets a fall to 143.30.

The USD/JPY drops from weekly highs around 144.90 due to improved market sentiment and also falling US bond yields, with the US 10-year T-note plunging 23 bps, from around 4.01% to 3.73%. At the time of writing, the USD/JPY is trading at 143.99, below its opening price by 0.57%.

USD/JPY Price Analysis: Technical outlook

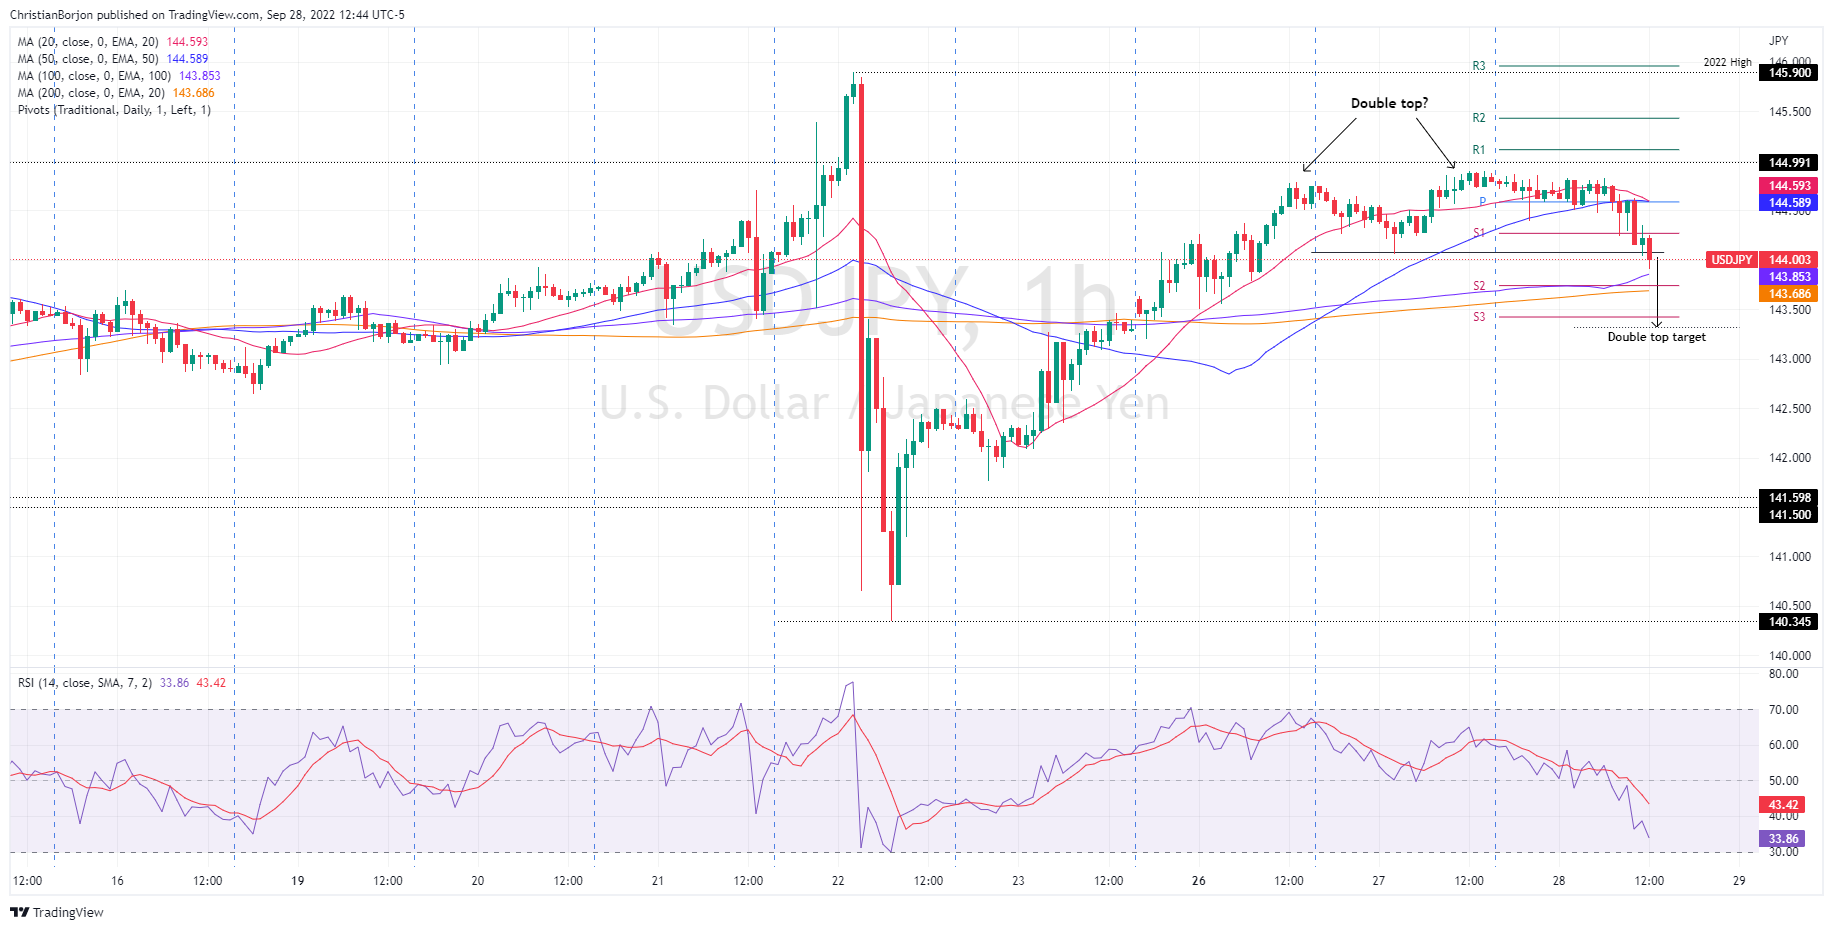
The USD/JPY daily chart depicts the pair as neutral-downward biased once Tuesday’s price action printed a doji. Worth noting that the Relative Strength Index (RSI) keeps pushing downwards while price action is below the September 27 daily low at 144.05, exacerbating a fall towards the 143.00 figure and beyond.

In yesterday’s article, “a double-top chart pattern is emerging at around the 144.60-75 area, which could pave the way for further losses. Nevertheless, the 20 and the 50-EMAs, meandering around 144.51 and 144.16, respectively, would be difficult to surpass.” It should be noted that the USD/JPY initially edged towards the weekly high, forming a “triple top” instead of a “double top,” and fell below the 20 and 50-day EMAs, accelerating the USD/JPY fall below the 144.00 mark.

Therefore, the USD/JPY first support would be 50-EMA at 143.85, immediately followed by the S2 daily pivot at 143.74, ahead of the  200-EMA at 143.68. A break below will expose the S3 pivot point at 143.42 and the triple top target at 143.30.

USD/JPY Key Technical Levels

USD/JPY

Overview
Today last price143.99
Today Daily Change-0.73
Today Daily Change %-0.50
Today daily open144.78
 
Trends
Daily SMA20142.81
Daily SMA50138.4
Daily SMA100135.74
Daily SMA200127.52
 
Levels
Previous Daily High144.9
Previous Daily Low144.06
Previous Weekly High145.9
Previous Weekly Low140.35
Previous Monthly High139.08
Previous Monthly Low130.4
Daily Fibonacci 38.2%144.58
Daily Fibonacci 61.8%144.38
Daily Pivot Point S1144.26
Daily Pivot Point S2143.74
Daily Pivot Point S3143.42
Daily Pivot Point R1145.11
Daily Pivot Point R2145.43
Daily Pivot Point R3145.95

Author

Christian Borjon Valencia

Christian Borjon began his career as a retail trader in 2010, mainly focused on technical analysis and strategies around it. He started as a swing trader, as he used to work in another industry unrelated to the financial markets.

More from Christian Borjon Valencia
Share:

Markets move fast. We move first.

Orange Juice Newsletter brings you expert driven insights - not headlines. Every day on your inbox.

By subscribing you agree to our Terms and conditions.

Editor's Picks

EUR/USD struggles to extend advance above 1.1800

The EUR/USD pair posts a fresh weekly low near 1.1740 during the Asian trading session on Wednesday. The major currency pair is under pressure as the US Dollar edges higher despite Federal Open Market Committee minutes of the December policy meeting, released on Tuesday, showing that most policymakers stressed the need for further interest rate cuts.

GBP/USD tests 1.3450 support after moving below nine-day EMA

GBP/USD remains subdued for the second consecutive day, trading around 1.3460 during the Asian hours on Wednesday. The technical analysis of the daily chart indicates a weakening of a bullish bias as the pair is positioned slightly below the lower boundary of the ascending channel pattern.

Gold jumps on US rate cut prospects, safe-haven demand

Gold price extends the rally above $4,350 during the early European trading hours on Wednesday. Gold's price has surged about 65% this year and is set to record its biggest annual gains since 1979. The rally in the precious metal is bolstered by the prospect of further US interest rate cuts in 2026. Lower interest rates could reduce the opportunity cost of holding Gold, supporting the non-yielding precious metal.

Bitcoin, Ethereum and XRP prepare for a potential New Year rebound

Bitcoin, Ethereum, and Ripple are holding steady on Wednesday after recording minor gains on the previous day. Technically, Bitcoin could extend gains within a triangle pattern while Ethereum and Ripple face critical overhead resistance. 

Economic outlook 2026-2027 in advanced countries: Solidity test

After a year marked by global economic resilience and ending on a note of optimism, 2026 looks promising and could be a year of solid economic performance. In our baseline scenario, we expect most of the supportive factors at work in 2025 to continue to play a role in 2026.

Crypto market outlook for 2026

Year 2025 was volatile, as crypto often is.  Among positive catalysts were favourable regulatory changes in the U.S., rise of Digital Asset Treasuries (DAT), adoption of AI and tokenization of Real-World-Assets (RWA).