|

USD/JPY Price Analysis: Traces firmer yields to refresh yearly top, 141.60 in the spotlight

  • USD/JPY jumps to the highest levels since November 2022, prints the biggest daily gains in a month.
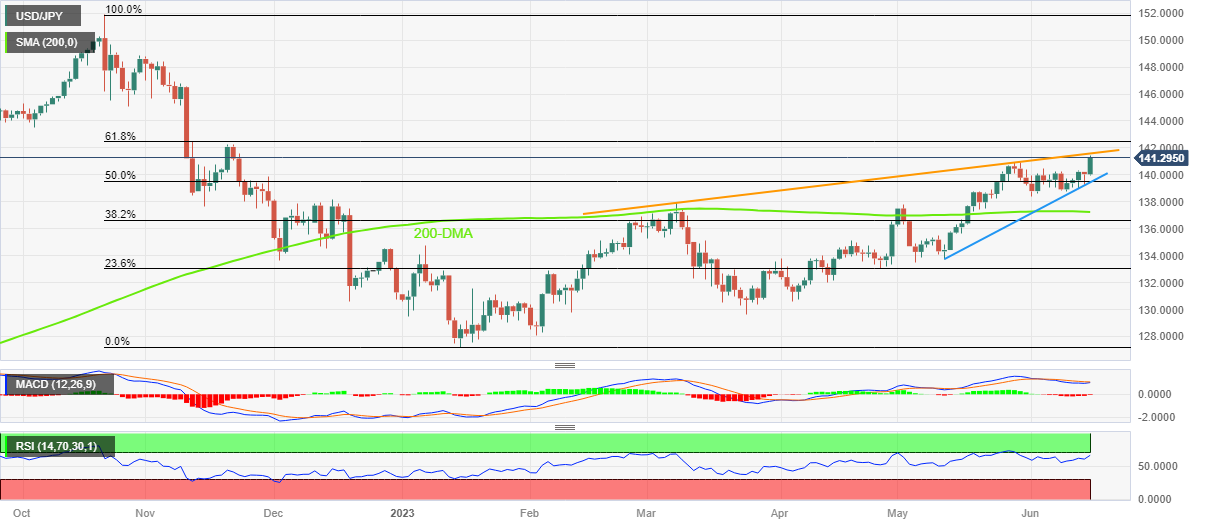
  • Upside break of previous yearly peak of around 141.00, looming bull cross on MACD favor Yen pair buyers.
  • Overbought RSI, ascending resistance line from early March limit further upside.

USD/JPY bulls are high as the Yen pair renews the yearly peak near 141.45 amid early Thursday. In doing so, the risk-barometer pair prints the biggest daily gains, so far, in a month amid upbeat US Treasury bond yields.

That said, the US 10-year Treasury bond yields rise three basis points (bps) to 3.83% by the press time, versus the previous day’s lackluster move near a three-week top. While tracing the firmer bond coupons, the hawkish Fed bias and economic fears gain major attention.

Also read: USD/JPY looks to build on momentum beyond 141.00, highest since November 2022

On the other hand, sustained trading beyond the previous high of 2023, of around 141.00, enables the USD/JPY buyers to keep the reins, especially amid an impending bull cross on the MACD.

However, the nearly overbought RSI (14) line joins a three-month-old rising trend line, near 141.60 at the latest, to cap the pair’s immediate upside.

It should be noted that the late November 2022 high of near 142.25 and the 61.8% Fibonacci retracement level of the pair’s October 2022 to January 2023 fall, near 142.45, act as additional upside filters for the USD/JPY bulls to cross for conviction.

On the flip side, a one-month-old rising support line joins the 50% Fibonacci retracement level to limit the short-term downside of the USD/JPY pair near 139.55. Following that, the 200-DMA support of near 137.25 will be in the spotlight.

That said, the 141.00 mark and the 140.00 psychological magnet are extra supports to watch for the Yen pair traders.

USD/JPY: Daily chart

Trend: Limited upside expected

Additional important levels

Overview
Today last price141.34
Today Daily Change1.28
Today Daily Change %0.91%
Today daily open140.06
 
Trends
Daily SMA20139.49
Daily SMA50136.54
Daily SMA100134.79
Daily SMA200137.26
 
Levels
Previous Daily High140.28
Previous Daily Low139.28
Previous Weekly High140.45
Previous Weekly Low138.76
Previous Monthly High140.93
Previous Monthly Low133.5
Daily Fibonacci 38.2%139.67
Daily Fibonacci 61.8%139.9
Daily Pivot Point S1139.46
Daily Pivot Point S2138.87
Daily Pivot Point S3138.46
Daily Pivot Point R1140.47
Daily Pivot Point R2140.88
Daily Pivot Point R3141.47

Author

Anil Panchal

Anil Panchal

FXStreet

Anil Panchal has nearly 15 years of experience in tracking financial markets. With a keen interest in macroeconomics, Anil aptly tracks global news/updates and stays well-informed about the global financial moves and their implications.

More from Anil Panchal
Share:

Editor's Picks

EUR/USD extends losses toward 1.1600 ahead of EU inflation data

EUR/USD extends the decline toward 1.1600 in the European session on Tuesday. The pair remains under pressure as surging energy prices amid the US-Iran war have increased the risks of higher inflation for the Old Continent. The focus is now on the Eurozone preliminary inflation reading for February. 

GBP/USD drops back toward three-month lows below 1.3350

GBP/USD is back in the red, accelerating its downside toward the three-month lows of 1.3315 in European trading on Tuesday. The ongoing escalation in the Iran war, combined with rising Oil prices, weighs negatively on the higher-yielding Pound Sterling as the US Dollar preserves the previous upside. 

Gold weakens below $5,300 as sustained USD buying counter Middle East tensions

Gold attracts some intraday selling and falls around $100 from the daily top, around the $5,380 area. The US Dollar climbs to a fresh high since January 20 and turns  out to be a key factor exerting downward pressure on the commodity. However, concerns about a broader regional conflict in the Middle East continue to weigh on investors' sentiment and underpin demand for the traditional safe-haven bullion.

Stellar risks deeper losses as derivatives metrics turn negative

Stellar is trading red below $0.16 at the time of writing on Tuesday, after a slight recovery the previous day. Weakening derivatives data caps the recovery, while an unfavorable technical outlook projects a deeper correction for the XLM token in the upcoming days.

The market is not panicking it is repricing the probability distribution of Oil and time

At the end of the day, markets do not trade morality or geopolitics. They trade transmission channels. And the only channel that truly matters in this maelstrom runs through the price of energy and the time value of money.

Hyperliquid Price Forecast: HYPE rises on commodities demand amid US-Iran war

Hyperliquid (HYPE) steadies above $33 at press time on Tuesday, marking its fourth consecutive day of recovery in a broadly volatile market due to the ongoing US-Israel strikes on Iran.