|

USD/JPY Price Analysis: To test the 20-day EMA after hitting a new session high around 130.50

  • USD/JPY recovers some ground as traders brace for a busy US economic calendar.
  • Buyers are eyeing a test of the 20-day EMA, as the RSI and RoC suggest the USD/JPY could print a leg-up in the near term.
  • SUD/JPY Price Analysis: Remains downward biased, but it could aim higher.

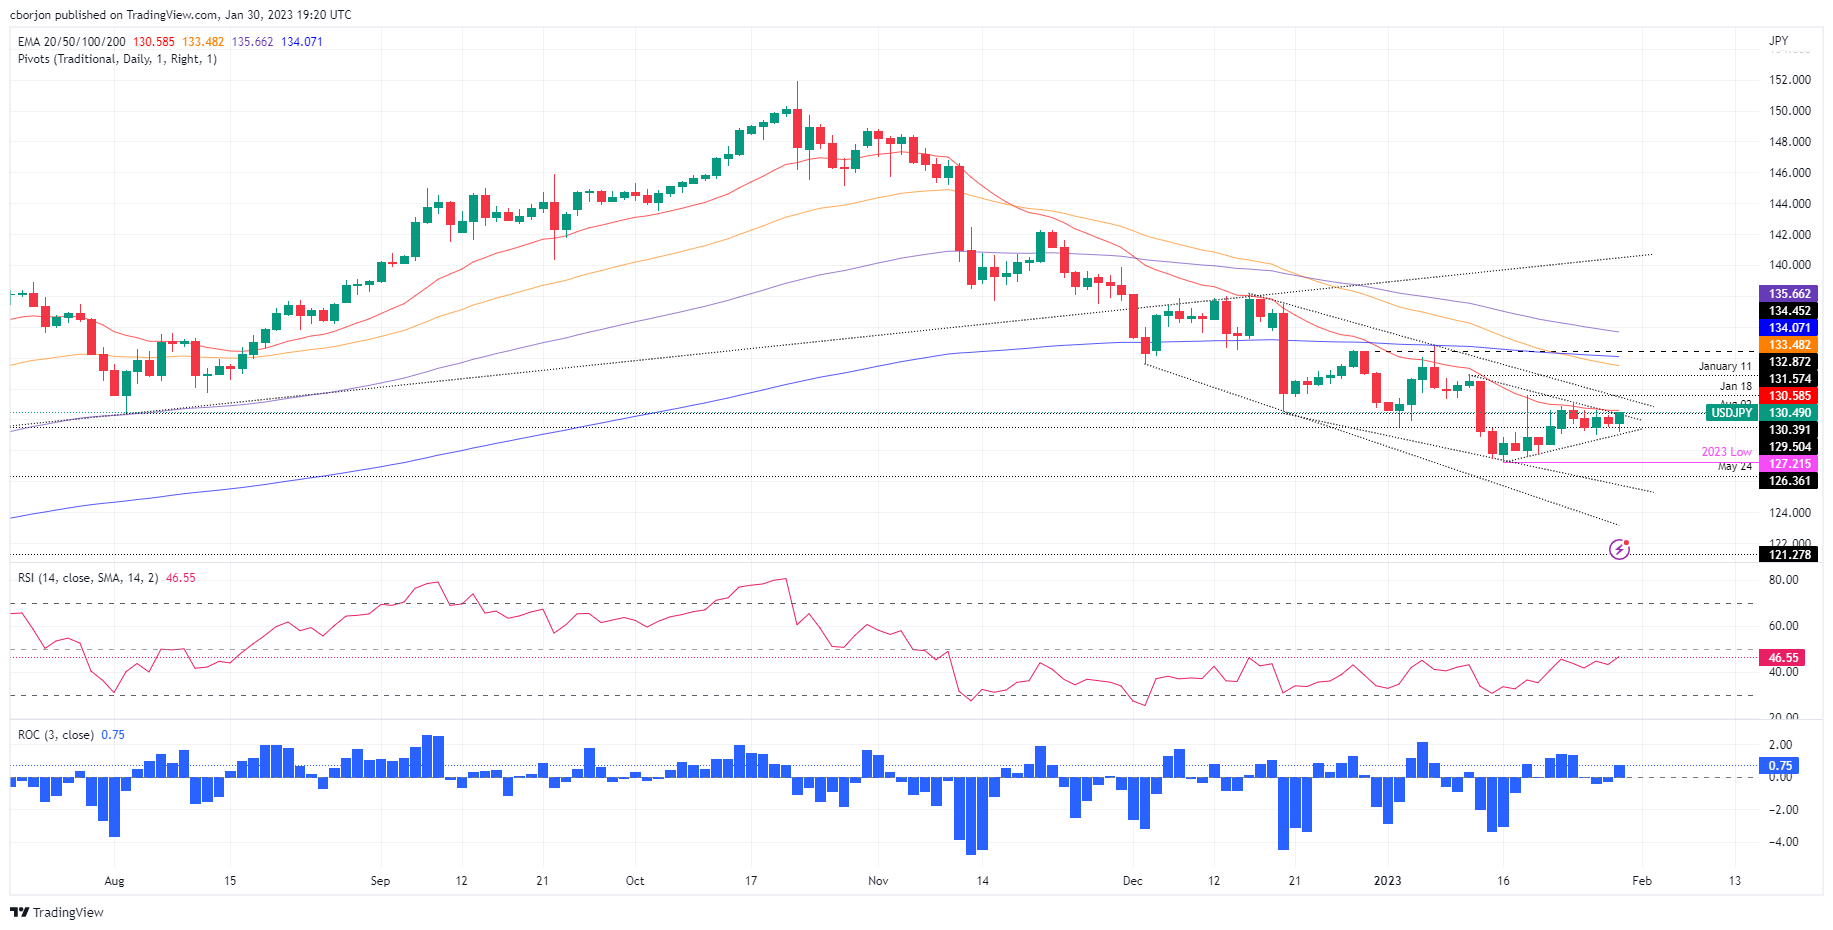
USD/JPY erases last Friday’s losses and reaches a new session high at 130.49, though slightly beneath the 20-day Exponential Moving Average (EMA), used as a barometer for short-term bias, which remains above the exchange rate. Therefore, the USD/JPY remains bearish despite trading at 130.49, above its opening price by 0.56%.

USD/JPY Price Analysis: Technical outlook

From a price action point of view, the USD/JPY remains bearish biased, even though it printed new daily highs. However, USD/JPY buyers need to clear the 20-day EMA at 130.57, to open the door for further gains. Traders should be aware the Rate of Change (RoC) depicts the buyer gaining momentum, while the Relative Strength Index (RSI) is about to turn bullish, suggesting that upward pressure is building.

Therefore, the USD/JPY first resistance would be the 131.00 figure. A breach of the latter will expose a one-month-old downslope trendline at around 131.330-40, followed by the January 18 daily high at 131.57, and then January’s 11 swing high

As an alternate scenario, if the USD/JPY tumbles below 130.00. the next support would be the January 30 daily low of 129.19. A breach of the latter will expose the psychological 128.00, followed by the YTD low at 127.21.

USD/JPY Key Technical Levels

USD/JPY

Overview
Today last price130.47
Today Daily Change0.59
Today Daily Change %0.45
Today daily open129.88
 
Trends
Daily SMA20130.38
Daily SMA50133.83
Daily SMA100139.46
Daily SMA200136.76
 
Levels
Previous Daily High130.28
Previous Daily Low129.5
Previous Weekly High131.12
Previous Weekly Low129.02
Previous Monthly High138.18
Previous Monthly Low130.57
Daily Fibonacci 38.2%129.8
Daily Fibonacci 61.8%129.98
Daily Pivot Point S1129.49
Daily Pivot Point S2129.11
Daily Pivot Point S3128.71
Daily Pivot Point R1130.27
Daily Pivot Point R2130.67
Daily Pivot Point R3131.05

Author

Christian Borjon Valencia

Markets analyst, news editor, and trading instructor with over 14 years of experience across FX, commodities, US equity indices, and global macro markets.

More from Christian Borjon Valencia
Share:

Editor's Picks

EUR/USD recovers some early losses driven by rising energy prices amid US-Iran war

The EUR/USD pair claws back some of its early losses during the late Asian trading session on Monday, but is still 0.25% down to near 1.1780. Earlier in the day, the Euro declined sharply against the US Dollar as investors shifted to the safe-haven fleet amid the brutal war between Iran, Israel, and the United States, which broke out over the weekend.

GBP/USD targets 1.3500 barrier near moving averages

GBP/USD rebounds from the daily losses, trading around 1.3450 during the Asian hours on Monday. The technical analysis of the daily chart indicates an ongoing bearish bias, as the pair trades within a descending channel pattern.

Gold looks further north as Iran war boosts haven demand

Gold is taking a breather after the initial run to over one-month highs near $5,400, kicking off the new week with a bang. A global flight to safety theme, following the US-Israel joint attacks on Iran over the weekend, bolstered the demand for the traditional store of value, Gold.

Bitcoin, Ethereum and Ripple under pressure as key supports face breakdown risk

Bitcoin, Ethereum, and Ripple prices trade on the back foot at the start of this week on Monday, after extending losses in the previous week. BTC is on the brink of a breakdown, ETH is capped below key resistance, and XRP risks a crack of the trendline.

The market is paying for insurance, not apocalypse

As expected, this morning felt less like a Monday market open and more like a fire drill. Futures screens flickered red. S&P contracts down almost 1%. Nasdaq off 1.2%. Brent leaped 13% through $80. Gold rose 1.6% toward $5350 before paring some gains. The dollar is strutting mildly. The Swiss franc is quietly doing what it always does in a storm, catching some safe-haven flows.

Starknet unveils strkBTC, shielded Bitcoin transactions on Ethereum Layer 2

Starknet, the Ethereum Layer 2 network developed by StarkWare, today announced strkBTC, a wrapped Bitcoin asset that introduces optional shielding while preserving full DeFi composability.