|

USD/JPY Price Analysis: Stumbles below 145.00 amid falling US bond yields as the pair turns bearish

  • USD/JPY down 0.72%, trading at 144.79, as falling US bond yields and soft economic data put pressure on the pair.
  • Technicals indicate a neutral to upward bias, but recent slip below key levels opens the door for further downside.
  • First support at August 23 swing low of 144.54; a decisive break could target the 143.00 mark.

USD/JPY retraced its earlier weekly gains, as the pair printed losses of 0.72% on Wednesday, courtesy of falling US bond yields, as US economic data was soft. As Thursday’s Asian session begins, the USD/JPY is trading at 144.79, down by a minimal 0.03%.

USD/JPY Price Analysis: Technical outlook

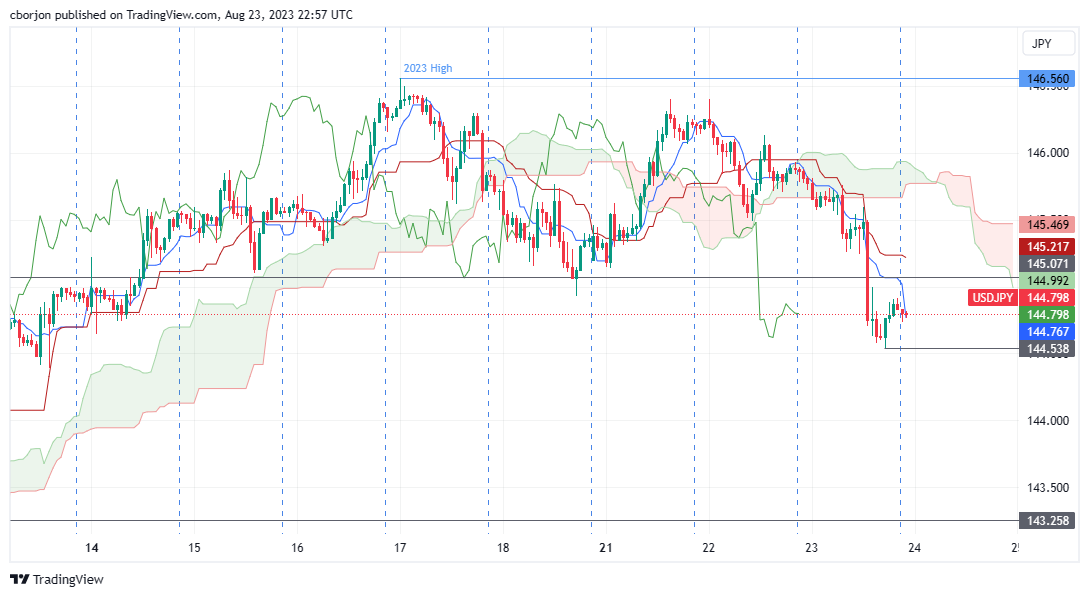
The USD/JPY is neutral to upward biased, but its fall below the Tenkan-Sen line at 145.54 opened the door for further losses. Price action is closing its distance from the Ichimoku Cloud (Kumo), which is still below the exchange rate, maintaining the bullish stance in the pair. But, given the USD/JPY slipped below the June 30 daily high and turned support at 145.07, it suggests the pair could extend its losses.

Short term, the USD/JPY hourly chart depicts the pair as bearish biased due to several technical indications: the Kijun-Sen is above the Tenkan-Sen line, usually the first sign of a change in the trend, followed by the Chikou Span breach below the price action, two days ago. That warrants further downside, alongside USD/JPY sliding below the Kumo.

First support would be the August 23 swing low of 144.54, followed by the August 10 daily low of 143.26. A decisive break and the USD/JPY could aim towards the 143.00 mark.

USD/JPY Price Action – Hourly chart

USD/JPY

Overview
Today last price144.79
Today Daily Change-1.10
Today Daily Change %-0.75
Today daily open145.89
 
Trends
Daily SMA20143.72
Daily SMA50142.57
Daily SMA100139.47
Daily SMA200136.6
 
Levels
Previous Daily High146.4
Previous Daily Low145.5
Previous Weekly High146.56
Previous Weekly Low144.65
Previous Monthly High144.91
Previous Monthly Low137.24
Daily Fibonacci 38.2%145.84
Daily Fibonacci 61.8%146.06
Daily Pivot Point S1145.46
Daily Pivot Point S2145.03
Daily Pivot Point S3144.56
Daily Pivot Point R1146.36
Daily Pivot Point R2146.83
Daily Pivot Point R3147.27
 

Author

Christian Borjon Valencia

Markets analyst, news editor, and trading instructor with over 14 years of experience across FX, commodities, US equity indices, and global macro markets.

More from Christian Borjon Valencia
Share:

Editor's Picks

EUR/USD gathers traction, approaches 1.1800

EUR/USD manages to reverse Tuesday’s pullback, advancing to two-day highs near the 1.1800 hurdle in the latter part of Wednesday’s session. The pair’s decent uptick comes on the back of the modest retracement in the US Dollar, as investors continue to closely follow developments on the trade front and news from the White House in the wake of President Trump’s SOTU speech.

GBP/USD challenges multi-day highs near 1.3530

GBP/USD leaves behind the previous day’s decline and regains fresh upside traction on Wednesday, surpassing the 1.3500 barrier in a context of a modest decline in the Greenback and a generalised improved mood in the risk-linked space. Meanwhile, the US tariff narrative continues to dictate the mood among market participants after Presidet Trump’s SOTU speech failed to surprise markets.

Gold remains bid and close to $5,200

Gold buyers are returning to the fold on Wednesday, targeting the $5,200 area and possibly beyond, after Tuesday’s corrective dip from monthly highs. The rebound in the precious metal comes as the US Dollar loses traction, with Trump’s SOTU speech offering little fresh direction and AI-related nerves continuing to ease.

Crypto Today: Bitcoin, Ethereum, XRP test rebound strength as ETF inflows return

Bitcoin, Ethereum and Ripple are gaining traction at the time of writing on Wednesday, amid persistent market doldrums. The Crypto King is up over 2% intraday, trading above $65,000 from the day’s opening of $64,058.

Nvidia earnings to influence AI trade and broader market sentiment

For the last three years, Nvidia has been the engine of the AI boom, and now Wall Street is watching to see whether that momentum can keep going. High-growth stocks have been struggling to maintain their bullish trend in 2026.

Cosmos Hub Price Forecast: ATOM rebounds slightly, bearish outlook remains intact

Cosmos Hub (ATOM) price rebounds, trading above $2.05 at the time of writing on Wednesday, after undergoing a sharp correction since last week. Weakening on-chain and derivatives data support a bearish outlook, while technical analysis remains unfavorable.