|

USD/JPY Price Analysis: Struggles at 157.00 as bearish engulfing chart pattern looms

  • USD/JPY retreats as it forms a bearish engulfing candle chart pattern.
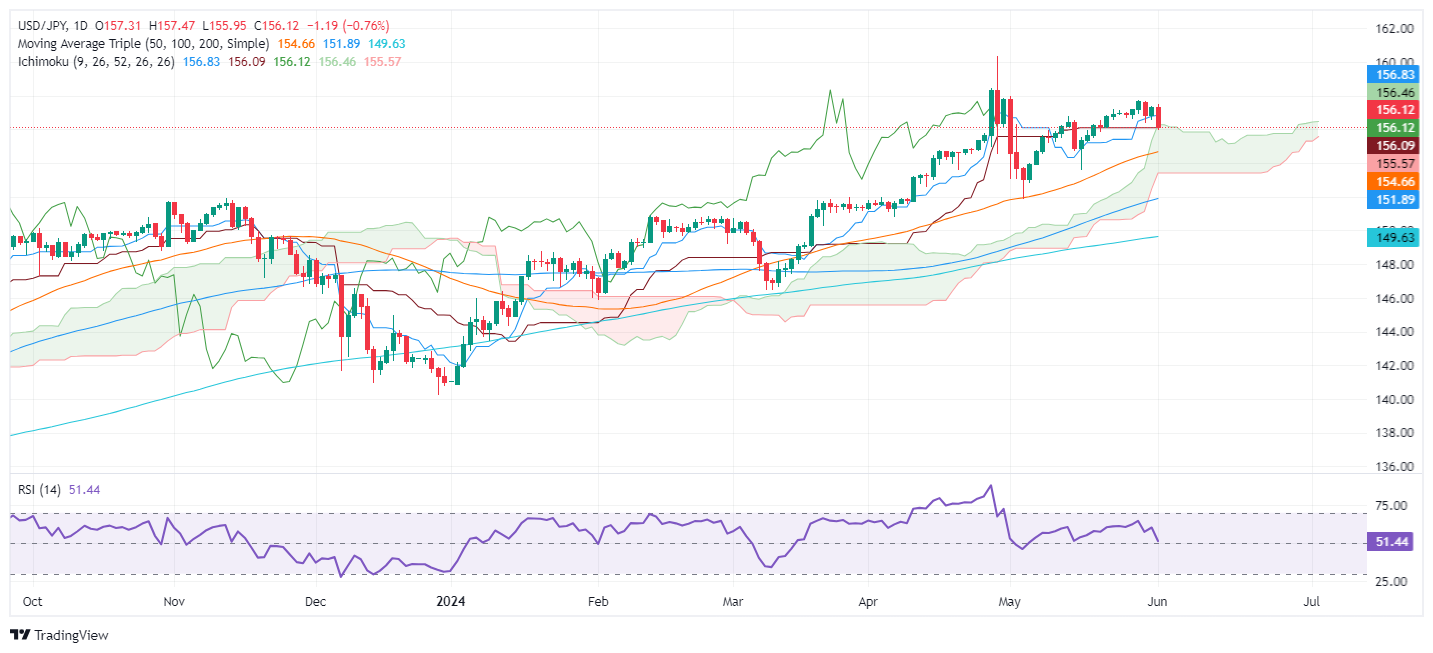
  • Technical outlook: USD/JPY drops below Ichimoku Cloud top at 155.95, hinting at potential further declines.
  • Key support levels: Tenkan-Sen at 154.92, 50-DMA at 154.74, and trendline at 154.20; resistance at Kumo top 156.15/20 and May 29 high of 157.71.

The USD/JPY retreated more than 0.70% on Monday following softer-than-expected business activity data in the United States (US). That, along with last Friday’s inflation report, the Fed’s Core PCE, reignited speculation that the US central bank could slash rates toward the end of the year. The pair trades at 156.14.

USD/JPY Price Analysis: Technical outlook

From a daily chart perspective, the USD/JPY failed to pierce the 157.50 resistance level and dived below the 157.00 figure, exacerbating a drop below the top of the Ichimoku Cloud (Kumo) at around 155.95, opening the door for further losses.

Even though momentum favors buyers, as depicted by the Relative Strength Index (RSI), it has turned flat close to the 50 midlines, about to enter bearish territory.

In the short term, the USD/JPY is neutral to downward biased. The first support would be the Tenkan-Sen at 154.92, followed by the 50-day moving average (DMA) at 154.74. Once cleared, the next stop would be an upslope support trendline at 154.20 before testing the bottom of the Kumo at 153.30/40.

Conversely, if USD/JPY climbs above the top of the Kumo at around 156.15/20, that would sponsor an uptick toward the May 29 high at 157.71.

USD/JPY Price Action – Daily Chart

USD/JPY

Overview
Today last price156.12
Today Daily Change-1.19
Today Daily Change %-0.76
Today daily open157.31
 
Trends
Daily SMA20156.15
Daily SMA50154.57
Daily SMA100151.79
Daily SMA200149.58
 
Levels
Previous Daily High157.37
Previous Daily Low156.56
Previous Weekly High157.71
Previous Weekly Low156.37
Previous Monthly High157.99
Previous Monthly Low151.86
Daily Fibonacci 38.2%157.06
Daily Fibonacci 61.8%156.87
Daily Pivot Point S1156.79
Daily Pivot Point S2156.27
Daily Pivot Point S3155.98
Daily Pivot Point R1157.6
Daily Pivot Point R2157.89
Daily Pivot Point R3158.41

Author

Christian Borjon Valencia

Markets analyst, news editor, and trading instructor with over 14 years of experience across FX, commodities, US equity indices, and global macro markets.

More from Christian Borjon Valencia
Share:

Editor's Picks

EUR/USD holds losses near 1.1850 as US, China holidays keep trade muted

EUR/USD opens the week on a softer note, trading near 1.1860 during the Asian session on Monday. Activity is likely to remain muted, with United States markets closed for the Presidents’ Day holiday, while Mainland China is also shut for the week-long Lunar New Year break.

GBP/USD flat lines as traders await key UK macro data and FOMC minutes

The GBP/USD pair kicks off a new week on a subdued note and oscillates in a narrow range, just below mid-1.3600s, during the Asian session. Moreover, the mixed fundamental backdrop warrants some caution for aggressive traders as the market focus now shifts to this week's important releases from the UK and the US.

Gold buyers hesitate amid holiday-thinned trading

Gold trades volatile, but within range, as US, China holidays-led thin trading exaggerates moves. The US Dollar extends range play into the US GDP week, with markets pricing at least two Fed rate cuts this year. Technically, Gold tests key support at $5,000; daily RSI still remains bullish.

Top Crypto Losers: Dogecoin, Zcash, Bonk – Meme and Privacy coins under pressure

Meme coins such as Dogecoin and Bonk, alongside the privacy coin Zcash (ZEC), are leading the broader market losses over the last 24 hours. DOGE, ZEC, and BONK ended their three consecutive days of recovery with a sudden decline on Sunday, as crucial resistance levels capped the gains. Technically, the altcoins show downside risk, starting the week under pressure.

Global inflation watch: Signs of cooling services inflation

Realized inflation landed close to expectations in January, as negative base effects weighed on the annual rates. Remaining sticky inflation is largely explained by services, while tariff-driven goods inflation remains limited even in the US.

Ripple Price Forecast: XRP potential bottom could be in sight

Ripple edges up above the intraday low of $1.35 at the time of writing on Friday amid mixed price actions across the crypto market. The remittance token failed to hold support at $1.40 the previous day, reflecting risk-off sentiment amid a decline in retail and institutional sentiment.