- USD/JPY faces pressure in an attempt to recapture 160.00 as fears of Japan’s intervention deepen.
- The BoJ looks to raise interest rates further as weak Yen continues to boost inflationary pressures.
- The US Dollar will be guided by the US core PCE inflation data for May.
The USD/JPY pair exhibits a subdued performance slightly below the psychological resistance of 160.00 in Tuesday’s European session. The rally in the asset appears to have stalled as investors expect a stealth intervention by Japan’s authority against excessive FX moves to limit the downside in the Japanese Yen.
Fears of Japan’s intervention in the FX domain intensified after country’s main currency diplomat Masato Kanda said on Monday that the government would intervene around the clock if necessary.
Also, expectations for the Bank of Japan (BoJ) to tighten policy further have improved as weak Yen is resulting in higher inflation by making exports competitive in global markets and increasing import costs. The BoJ minutes for the latest meeting showed that one member advocated for an increase "without too much delay" to help bring inflation back down, Reuters reported.
Meanwhile, the US Dollar (USD) struggles to gain ground as investors expect that the Federal Reserve (Fed) will deliver two rate cuts this year and will choose the September meeting to begin the policy-normalization process. This week, the major trigger for the US Dollar will be the United States (US) core Personal Consumption Expenditure price index (PCE) for May, which will be published on Friday.
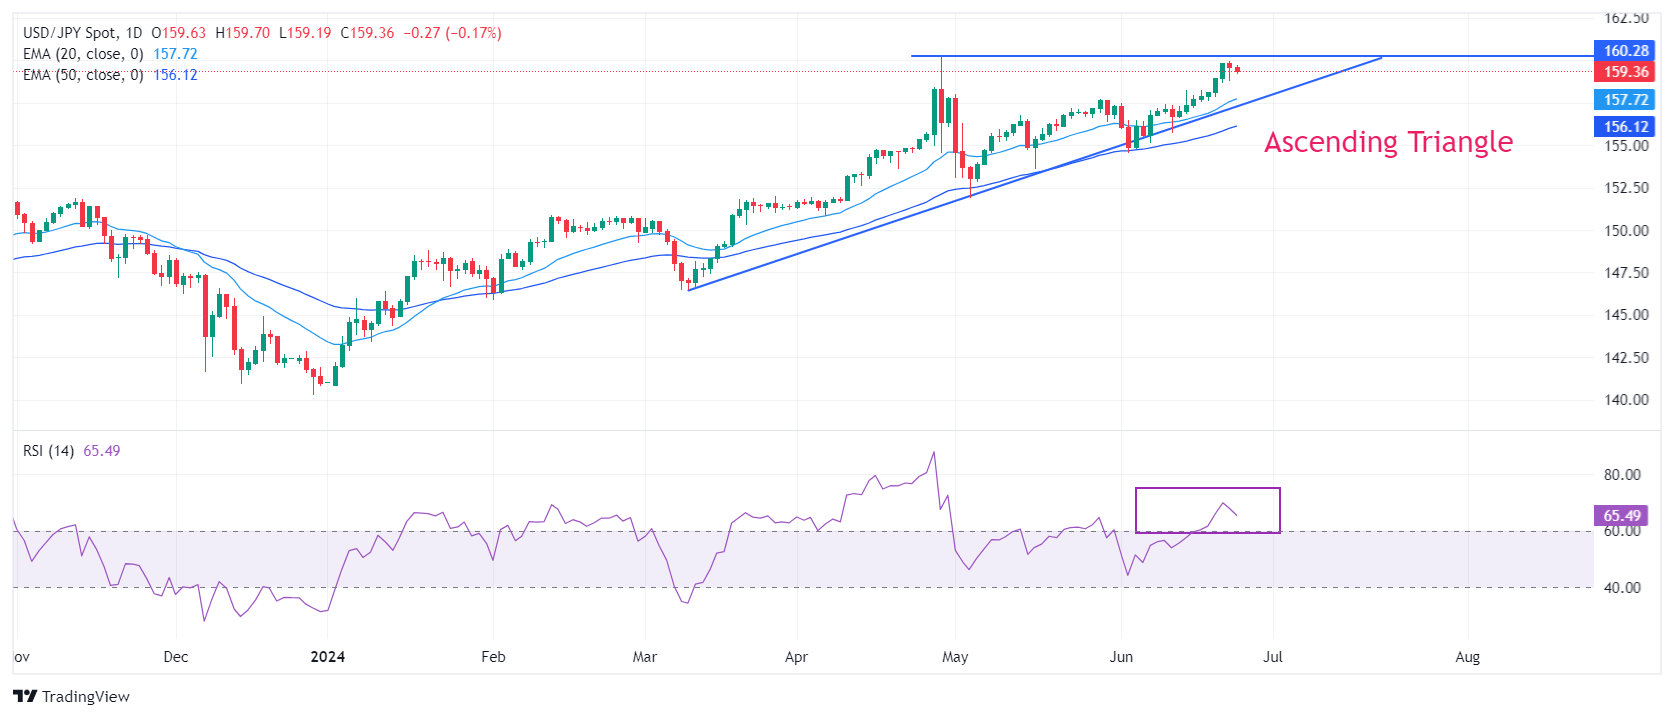
USD/JPY hovers near the horizontal resistance of the Ascending Triangle chart formation on a daily timeframe, which is plotted from April 29 high of 160.32. The upward-sloping border of the above-mentioned chart pattern is placed from March 11 low near 146.50.
Advancing 20- and 50-day Exponential Moving Averages (EMAs) near 157.70 and 156.10, respectively, indicate that the overall trend is bullish.
The 14-day Relative Strength Index (RSI) oscillates inside the 60.00-80.00 range, suggesting that momentum is already in favor of bulls.
More upside would appear if the asset breaks above multi-year high of 160.00. Breach of the latter will expose the pair in unchartered territory towards 162.00
On the flip side, a breakdown below May 16 low at 153.60 will expose the asst towards May 3 low at 151.86, followed by the psychological support of 150.00.
USD/JPY daily chart
Information on these pages contains forward-looking statements that involve risks and uncertainties. Markets and instruments profiled on this page are for informational purposes only and should not in any way come across as a recommendation to buy or sell in these assets. You should do your own thorough research before making any investment decisions. FXStreet does not in any way guarantee that this information is free from mistakes, errors, or material misstatements. It also does not guarantee that this information is of a timely nature. Investing in Open Markets involves a great deal of risk, including the loss of all or a portion of your investment, as well as emotional distress. All risks, losses and costs associated with investing, including total loss of principal, are your responsibility. The views and opinions expressed in this article are those of the authors and do not necessarily reflect the official policy or position of FXStreet nor its advertisers. The author will not be held responsible for information that is found at the end of links posted on this page.
If not otherwise explicitly mentioned in the body of the article, at the time of writing, the author has no position in any stock mentioned in this article and no business relationship with any company mentioned. The author has not received compensation for writing this article, other than from FXStreet.
FXStreet and the author do not provide personalized recommendations. The author makes no representations as to the accuracy, completeness, or suitability of this information. FXStreet and the author will not be liable for any errors, omissions or any losses, injuries or damages arising from this information and its display or use. Errors and omissions excepted.
The author and FXStreet are not registered investment advisors and nothing in this article is intended to be investment advice.


Recommended content
Editors’ Picks

EUR/USD stays pressured near 1.1350 on USD rebound
EUR/USD trades in negative territory at around 1.1350 on Friday. Renewed US Dollar strength on growing optimism surrounding the US-China trade war de-escalation keeps the pair undermined. Trade talks and US data remain in focus.

GBP/USD consolidates losses near 1.3300 after UK Retail Sales data
GBP/USD remains under moderate selling pressure near 1.3300 despite the upbeat UK Retail Sales data for March. The pair feels the heat of the solid US Dollar rebound, aided by a Bloomberg report, which indicated China may suspend its 125% tariff on select US imports.

Gold drops below $3,300 as market mood improves
Gold turns south following Thursday's rebound and trades below $3,300 on Friday. The move down comes amid growing optimism about a de-escalation of the US-China trade conflict after US President Trump hinted at the beginning of negotiations.

Ethereum: Accumulation addresses grab 1.11 million ETH as bullish momentum rises
Ethereum saw a 1% decline on Friday as sellers dominated exchange activity in the past 24 hours. Despite the recent selling, increased inflows into accumulation addresses and declining net taker volume show a gradual return of bullish momentum.

Five fundamentals for the week: Traders confront the trade war, important surveys, key Fed speech Premium
Will the US strike a trade deal with Japan? That would be positive progress. However, recent developments are not that positive, and there's only one certainty: headlines will dominate markets. Fresh US economic data is also of interest.

The Best brokers to trade EUR/USD
SPONSORED Discover the top brokers for trading EUR/USD in 2025. Our list features brokers with competitive spreads, fast execution, and powerful platforms. Whether you're a beginner or an expert, find the right partner to navigate the dynamic Forex market.