|

USD/JPY Price Analysis: Sellers attack previous resistance with eyes on 137.10

  • USD/JPY remains depressed after reversing from the highest levels in six months.
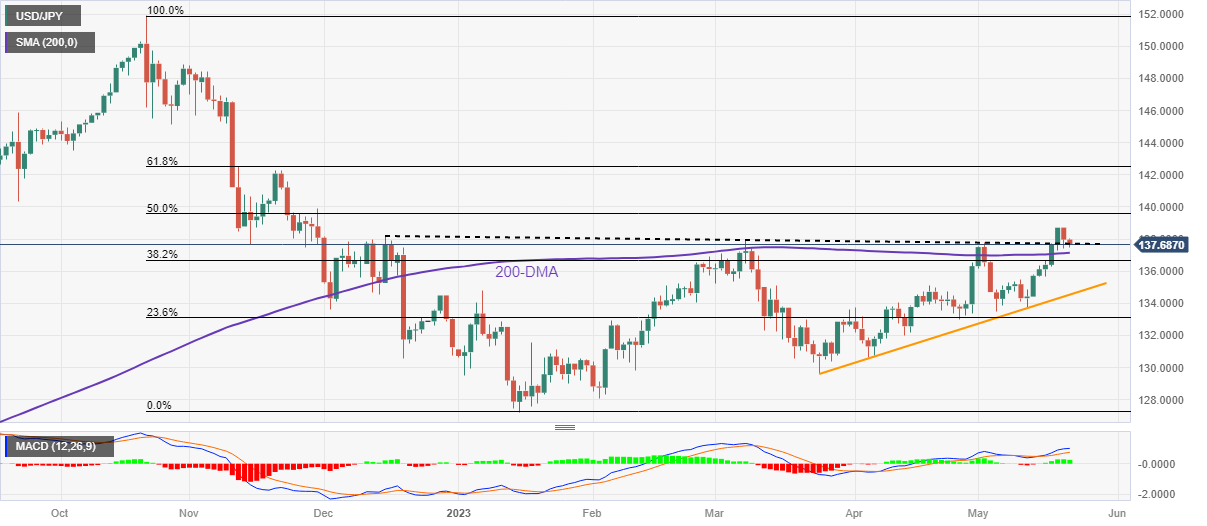
  • Bullish MACD signals join resistance-turned-support line, 200-DMA to prod Yen pair sellers.
  • USD/JPY buyers need validation from 140.00 round figure to keep the reins.

USD/JPY holds lower ground near 137.70-60 as it prods the multi-month-old support line, previous resistance, during early Monday morning in Europe. In doing so, the Yen pair extends the previous day’s U-turn from the highest levels since late November 2022.

It’s worth noting, however, that the bullish MACD signals join the aforementioned resistance-turned-support line from mid-December 2022, around 137.65 at the latest, to challenge the USD/JPY bears.

Even if the Yen pair marks a daily closing below 137.65, the 200-DMA level surrounding 137.10, quickly followed by the 137.00 round figure, may restrict the quote’s further downside.

In a case where the Yen pair drops below 137.00, the odds of witnessing the quote’s slump towards the early April swing high of around 135.15 can’t be ruled out. Following that, a two-month-long ascending support line near 134.55 can act as the last defense of the USD/JPY buyers.

On the flip side, USD/JPY recovery may initially aim for the latest swing high of near 138.75.

However, the 50% Fibonacci retracement of the pair’s October 2022 to January 2023 downturn, close to 139.60, will presede the late November 2022 top surrounding 139.90 and the 140.00 psychological magnet to challenge short-term the Yen pair buyers.

Should the USD/JPY bulls keep the reins past 140.00, an upward trajectory towards the 61.8% Fibonacci retracement level near 142.50 can’t be ruled out.

USD/JPY: Daily chart

Trend: Bullish

Additional impotant levels

Overview
Today last price137.72
Today Daily Change-0.25
Today Daily Change %-0.18%
Today daily open137.97
 
Trends
Daily SMA20135.57
Daily SMA50133.87
Daily SMA100133.14
Daily SMA200137.12
 
Levels
Previous Daily High138.73
Previous Daily Low137.43
Previous Weekly High138.75
Previous Weekly Low135.65
Previous Monthly High136.56
Previous Monthly Low130.63
Daily Fibonacci 38.2%137.93
Daily Fibonacci 61.8%138.23
Daily Pivot Point S1137.35
Daily Pivot Point S2136.74
Daily Pivot Point S3136.05
Daily Pivot Point R1138.66
Daily Pivot Point R2139.35
Daily Pivot Point R3139.96

Author

Anil Panchal

Anil Panchal

FXStreet

Anil Panchal has nearly 15 years of experience in tracking financial markets. With a keen interest in macroeconomics, Anil aptly tracks global news/updates and stays well-informed about the global financial moves and their implications.

More from Anil Panchal
Share:

Editor's Picks

EUR/USD softens below 1.1800 on Fed hawkish remarks

The EUR/USD pair edges lower to around 1.1775 during the early Asian session on Wednesday, pressured by a renewed US Dollar demand. Traders await the US President Donald Trump's State of the Union address later on Wednesday for clarity on fiscal policies. 

GBP/USD regains 1.3500 and above

GBP/USD extends its advance for the third day in a row on Tuesday, this time retesting the area beyond the 1.3500 hurdle. Cable’s uptick comes despite decent gains in the Greenback and the dovish message from the BoE’s Bailey at the UK Parliament.

Gold consolidates below $5,150 as traders await Trump's State of the Union address

Gold steadies below the $5,150 level following the previous day's pullback from the monthly peak as traders opt to wait on the sidelines ahead of Trump's State of the Union address. In the meantime, trade-related uncertainties and geopolitical risks seem to act as a tailwind for the safe-haven bullion. However, the Fed's less hawkish outlook underpins the US Dollar, which, along with a positive risk tone, caps the upside for the non-yielding yellow metal.

Hyperliquid registers mild gains following CoinShares' ETP launch

Hyperliquid registered a 3% gain on Tuesday after CoinShares announced the launch of its Physical Hyperliquid Staking exchange-traded product, offering investors exposure to the token's price and staking yields.

The Citrini report: How a debatable AI narrative can shake Wall Street

That AI-related headline alone was enough to rattle investors.US stocks slid sharply on Monday after a widely circulated Citrini Research memo outlined a hypothetical “2028 Global Intelligence Crisis”, warning that rapid AI adoption could push US unemployment into double digits as early as by mid-2028.

XRP pressured by weak ETF flows and declining retail interest

Ripple (XRP) is edging lower, trading above its intraday low of $1.32 at the time of writing on Tuesday. The decline from its weekly opening of $1.39 reflects heightened volatility in the broader cryptocurrency market, accentuated by tariff-triggered uncertainty.