|

USD/JPY Price Analysis: Seesawed around 131.90s on mixed mood

  • USD/JPY falters to extend its downtrend after forming a bearish engulfing candle pattern.
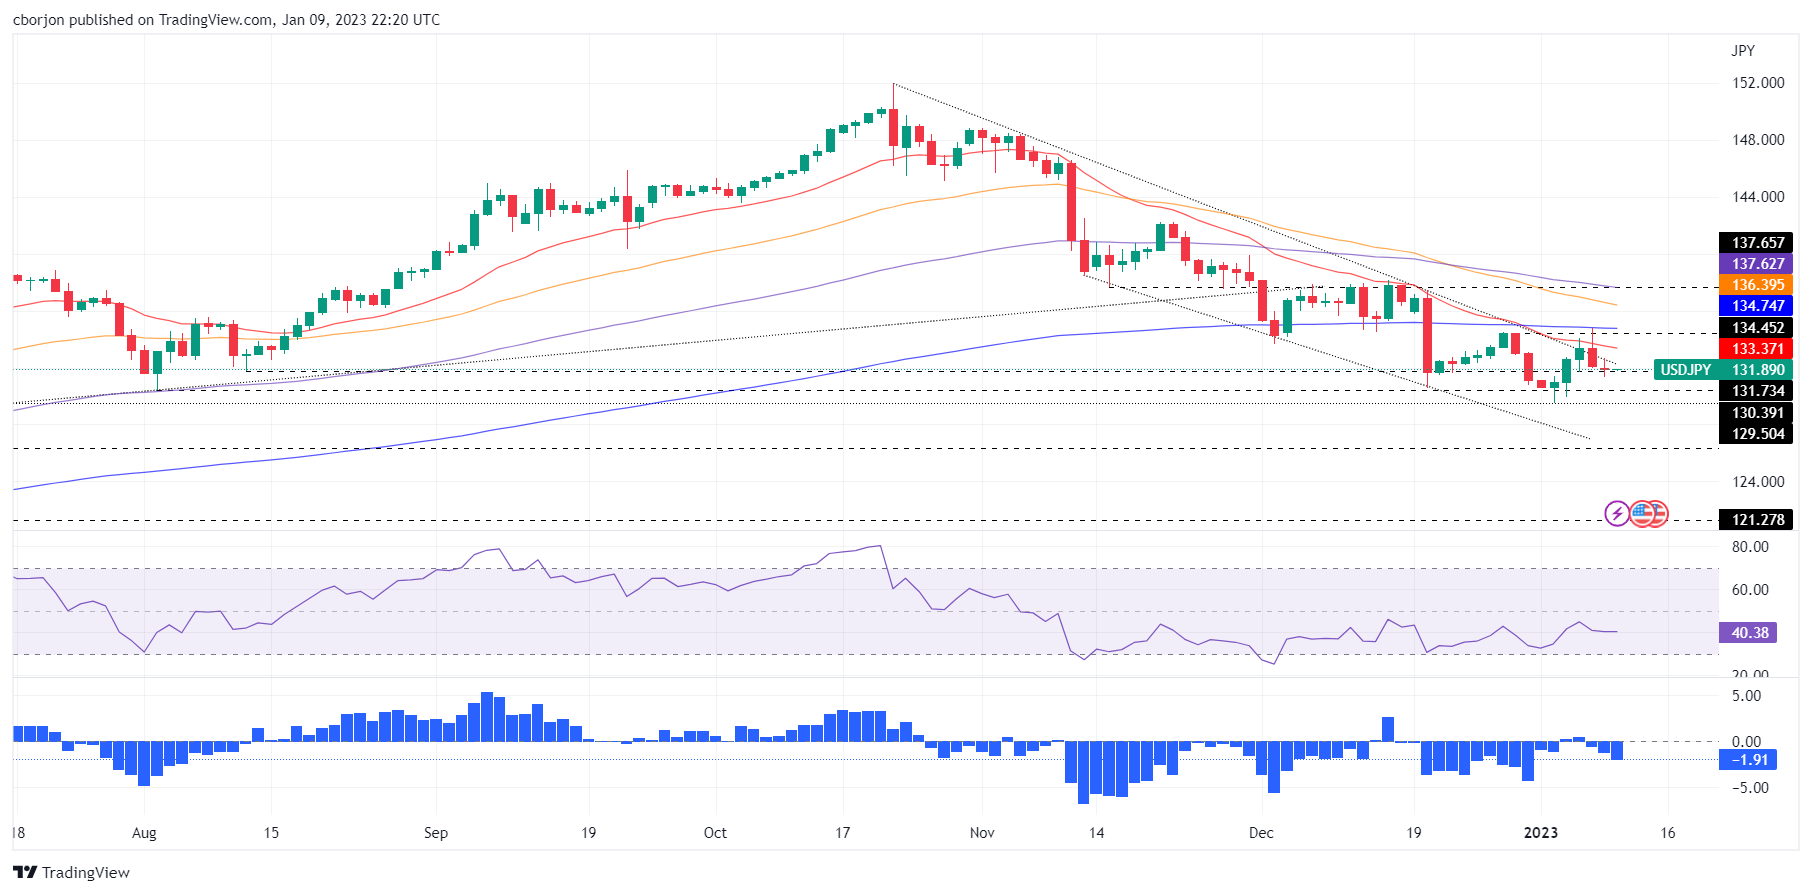
  • The RSI and the RoC suggest that the USD/JPY might resume downwards, though it needs the USD/JPY to fall below 131.30.

The USD/JPY is almost flat as Monday’s New York session wanes, printing a doji preceded by a bearish engulfing candle pattern that failed to trigger downward action. The USD/JPY dived as low as 131.30, still almost unchanged, down by 0.17%. At the time of typing, the USD/JPY is trading at 131.88.

USD/JPY Price Analysis: Technical outlook

After testing the 200-day Exponential Moving Average (EMA) at around 134.70s on Friday, the USD/JPY remained almost unchanged as risk appetite improved and safe-haven peers weakened. Therefore, the USD/JPY seesawed between the high/low of 132.65-131.30 before stabilizing around 131.80s, without buyers/sellers having the upper hand. Should be said that the Relative Strength Index (RSI) portrays the pair as bearish biased, though the Rate of Change (RoC) shows momentum heading downwards.

Hence, the USD/JPY might resume its downtrend, but it would need to hurdle some support levels on its way down. The USD/JPY first support would be the January 9 daily low of 131.30. Break below will expose the 131.00 figure, followed by the January 4 swing low of 129.92 and the YTD low of 129.50.

USD/JPY Key Technical Levels

USD/JPY

Overview
Today last price131.88
Today Daily Change-0.22
Today Daily Change %-0.17
Today daily open132.1
 
Trends
Daily SMA20133.72
Daily SMA50138.02
Daily SMA100140.95
Daily SMA200136.46
 
Levels
Previous Daily High134.78
Previous Daily Low131.99
Previous Weekly High134.78
Previous Weekly Low129.51
Previous Monthly High138.18
Previous Monthly Low130.57
Daily Fibonacci 38.2%133.06
Daily Fibonacci 61.8%133.71
Daily Pivot Point S1131.14
Daily Pivot Point S2130.17
Daily Pivot Point S3128.35
Daily Pivot Point R1133.92
Daily Pivot Point R2135.74
Daily Pivot Point R3136.7

Author

Christian Borjon Valencia

Markets analyst, news editor, and trading instructor with over 14 years of experience across FX, commodities, US equity indices, and global macro markets.

More from Christian Borjon Valencia
Share:

Editor's Picks

EUR/USD keeps the rangebound trade near 1.1850

EUR/USD is still under pressure, drifting back towards the 1.1850 area as Monday’s session draws to a close. The modest decline in spot comes as the US Dollar picks up a bit of support, while thin liquidity and muted volatility, thanks to the US market holiday, are exaggerating price swings and keeping trading conditions choppy.
 

GBP/USD flirts with daily lows near 1.3630

GBP/USD has quickly given back Friday’s solid gains, turning lower at the start of the week and drifting back towards the 1.3630 area. The focus now shifts squarely to Tuesday’s UK labour market report, which is likely to keep the quid firmly in the spotlight and could set the tone for Cable’s next move.

Gold battle around $5,000 continues

Gold is giving back part of Friday’s sharp rebound, deflating below the key $5,000 mark per troy ounce as the new week gets underway. Modest gains in the US Dollar are keeping the metal in check, while thin trading conditions, due to the Presidents Day holiday in the US, are adding to the choppy and hesitant tone across markets.

AI Crypto Update: Bittensor eyes breakout as AI tokens falter 

The artificial intelligence (AI) cryptocurrency segment is witnessing heightened volatility, with top tokens such as Near Protocol (NEAR) struggling to gain traction amid the persistent decline in January and February.

The week ahead: Key inflation readings and why the AI trade could be overdone

It is likely to be a quiet start to the week, with US markets closed on Monday for Presidents Day. European markets are higher across the board and gold is clinging to the $5,000 level after the tamer than expected CPI report in the US reduced haven flows to precious metals.

XRP steadies in narrow range as fund inflows, futures interest rise

Ripple is trading in a narrow range between $1.45 (immediate support) and $1.50 (resistance) at the time of writing on Monday. The remittance token extended its recovery last week, peaking at $1.67 on Sunday from the weekly open at $1.43.