USD/JPY Price Analysis: Retreats towards 100-SMA support above 132.00


  • USD/JPY prints three-day downtrend, fades the previous day’s corrective bounce off weekly low.
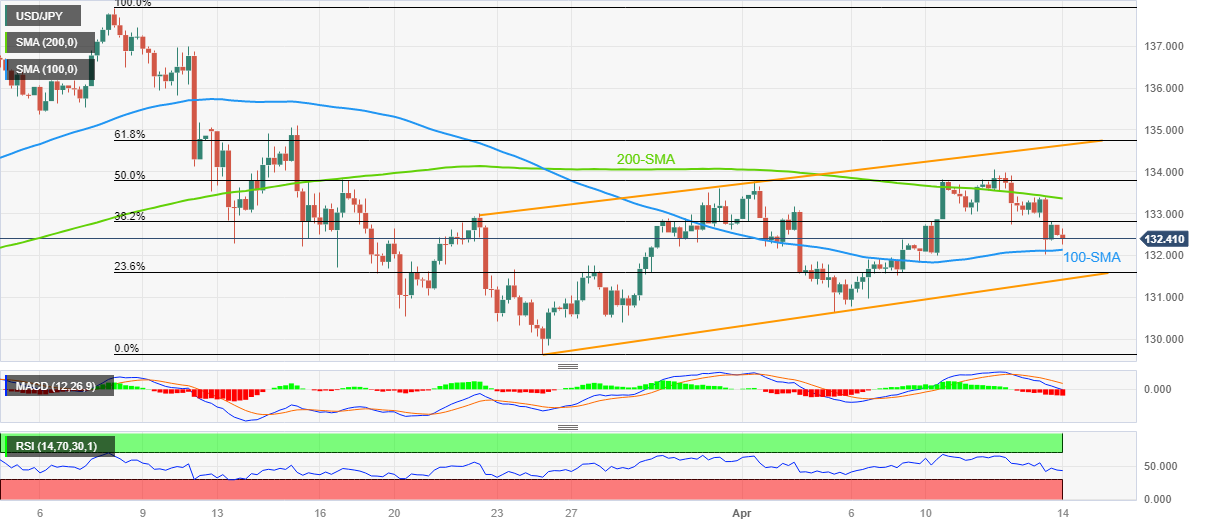
  • Three-week-old ascending trend channel keeps the Yen pair buyers hopeful beyond 131.40.
  • Bearish oscillators, repeated pullbacks from 200-SMA favor sellers.

USD/JPY holds lower ground near 132.40 as it drops for the third consecutive day during early Friday, reversing late Thursday’s corrective bounce.

That said, the quote’s failure to extend the previous day’s rebound beyond the 38.2% Fibonacci retracement level of USD/JPY’s fall during March seems to tease the pair sellers. Adding strength to the downside bias are the bearish MACD signals and downbeat RSI (14), not oversold.

With this, the USD/JPY is well-set to retest the 100-SMA support of around 132.15. However, the quote’s further weakness appears limited at a three-week-long bullish trend channel that could challenge the Yean pair bears around 131.40.

Should the quote breaks the 131.40 support, the monthly low near 130.60 and the 130.00 psychological magnet can check the USD/JPY sellers before directing them to the yearly low of 129.65 marked in March.

On the flip side, the 38.2% Fibonacci retracement level of 132.85 guards the quote’s immediate upside ahead of the 200-SMA hurdle of 133.35.

Though, the 50% Fibonacci retracement and the aforementioned channel’s top line, respectively near 133.85 and 134.60, can challenge the USD/JPY buyers afterward.

Also acting as an upside filter is the 61.8% Fibonacci retracement of around 134.80, also known as the golden Fibonacci ratio, as well as tops marked during March 10-15, close to 135.10-15.

USD/JPY: Four-hour chart

Trend: Limited downside expected

Additional important levels

Overview
Today last price 132.38
Today Daily Change -0.19
Today Daily Change % -0.14%
Today daily open 132.57
 
Trends
Daily SMA20 132.1
Daily SMA50 133.42
Daily SMA100 133.19
Daily SMA200 137.17
 
Levels
Previous Daily High 133.39
Previous Daily Low 132.02
Previous Weekly High 133.76
Previous Weekly Low 130.63
Previous Monthly High 137.91
Previous Monthly Low 129.64
Daily Fibonacci 38.2% 132.55
Daily Fibonacci 61.8% 132.87
Daily Pivot Point S1 131.93
Daily Pivot Point S2 131.29
Daily Pivot Point S3 130.57
Daily Pivot Point R1 133.3
Daily Pivot Point R2 134.03
Daily Pivot Point R3 134.67


Share: Feed news

Information on these pages contains forward-looking statements that involve risks and uncertainties. Markets and instruments profiled on this page are for informational purposes only and should not in any way come across as a recommendation to buy or sell in these assets. You should do your own thorough research before making any investment decisions. FXStreet does not in any way guarantee that this information is free from mistakes, errors, or material misstatements. It also does not guarantee that this information is of a timely nature. Investing in Open Markets involves a great deal of risk, including the loss of all or a portion of your investment, as well as emotional distress. All risks, losses and costs associated with investing, including total loss of principal, are your responsibility. The views and opinions expressed in this article are those of the authors and do not necessarily reflect the official policy or position of FXStreet nor its advertisers. The author will not be held responsible for information that is found at the end of links posted on this page.

If not otherwise explicitly mentioned in the body of the article, at the time of writing, the author has no position in any stock mentioned in this article and no business relationship with any company mentioned. The author has not received compensation for writing this article, other than from FXStreet.

FXStreet and the author do not provide personalized recommendations. The author makes no representations as to the accuracy, completeness, or suitability of this information. FXStreet and the author will not be liable for any errors, omissions or any losses, injuries or damages arising from this information and its display or use. Errors and omissions excepted.

The author and FXStreet are not registered investment advisors and nothing in this article is intended to be investment advice.

Recommended content


Recommended content

Editors’ Picks

Gold hits new all-time highs above $3,020, Trump-Putin call eyed

Gold hits new all-time highs above $3,020, Trump-Putin call eyed

Gold price is printing fresh record highs above $3,020 on Tuesday as Middle East tensions intensify. Israel resumed military operations against Hamas in Gaza after the group rejected US proposals for extending ceasefire. All eyes now remain on the Trump-Putin call. 

Gold News
EUR/USD retreats from fresh 2025 highs, flirts with 1.0900

EUR/USD retreats from fresh 2025 highs, flirts with 1.0900

EUR/USD retreats from fresh record highs and approaches 1.0900 on Tuesday, helped by encouraging US data. Optimism around the German vote on the spending plan and Trump-Putin talks underpin the positive mood despite escalating Middle East tensions. 

EUR/USD News
GBP/USD edges sharply lower after testing the 1.3000 mark

GBP/USD edges sharply lower after testing the 1.3000 mark

GBP/USD retreats sharply after testing the 1.3000 threshold, now hovering around 1.2950. The US Dollar made a strong comeback early in the American session, helped by upbeat local data and despite mounting geopolitical tensions in the Middle East. Focus also on Russia-Ukraine headlines.

GBP/USD News
Trump-Putin talks raise hopes of a ceasefire – Middle East risk returns

Trump-Putin talks raise hopes of a ceasefire – Middle East risk returns

The prospective end to the Russia-Ukraine war has traders excited for a more positive growth outlook in Europe going forward, with heavily industrialised nations such as Germany having suffered under the weight of elevated energy costs in recent years. 

Read more
Tariff wars are stories that usually end badly

Tariff wars are stories that usually end badly

In a 1933 article on national self-sufficiency1, British economist John Maynard Keynes advised “those who seek to disembarrass a country from its entanglements” to be “very slow and wary” and illustrated his point with the following image: “It should not be a matter of tearing up roots but of slowly training a plant to grow in a different direction”.

Read more
The Best brokers to trade EUR/USD

The Best brokers to trade EUR/USD

SPONSORED Discover the top brokers for trading EUR/USD in 2025. Our list features brokers with competitive spreads, fast execution, and powerful platforms. Whether you're a beginner or an expert, find the right partner to navigate the dynamic Forex market.

Read More

Forex MAJORS

Cryptocurrencies

Signatures

Best Brokers of 2025