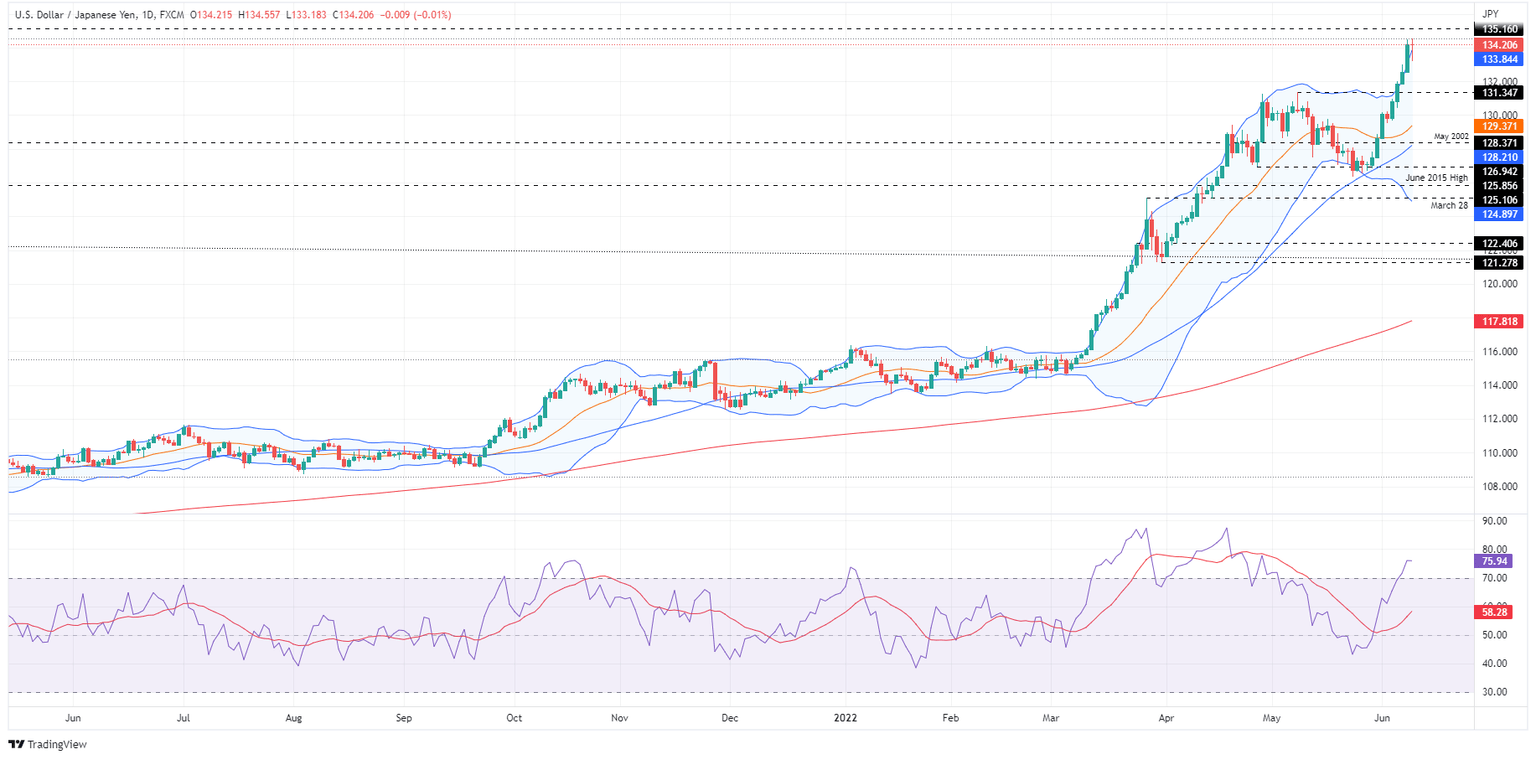
- USD/JPY dips towards 134.00 as buyers book profits ahead of Friday’s US CPI.
- Sentiment remains negative as US equities record losses.
- USD/JPY Price Forecast: The major is upward biased, but negative divergence in the weekly/daily chart might open the door for a pullback towards 131.00.
The USD/JPY retreats from 2-decade highs around 134.55 but is trimming substantial losses, and albeit losing 0.09%, is preparing for a test of the 135.00 figure. At the time of writing, the USD/JPY is trading at 134.20, a signal that traders are booking profits ahead of the release of US inflation data on Friday.
USD/JPY falls as bulls take profits
A dismal market mood keeps global equities pressured. In the FX space, the safe-haven currencies are rising. The USD/JPY is dropping, as above-mentioned by profit-taking and the closeness of the 135.00 mark, seen by some Japanese officials as a line of the sand to intervene in the FX markets.
In the meantime, the US Dollar remains bid, gaining 0.59% as portrayed by the US Dollar Index. The DXY is sitting at 103.151, underpinned by the US 10-year benchmark note rate parked around 3.033%.
Elsewhere, the USD/JPY topped around 134.50 and edged lower, breaking demand zones on its way south, like the daily pivot point at 133.74 and stopped shy of the S1 pivot point, at 133.01.
USD/JPY Price Forecast: Technical outlook
The USD/JPY monthly chart depicts the pair as upward biased, but RSI readings at 83 suggest the major might be about to peak soon. However, a rally towards 2002’s yearly high at 135.16 is on the cards. If the USD/JPY clears that hurdle, then a move towards the August 1998 high at 147.67 is on the cards.
The USD/JPY weekly chart illustrates the formation of a negative divergence between price action and the Relative Strength Index (RSI). If that scenario plays out, the USD/JPY could fall towards 131.34.
The USD/JPY daily chart portrays the pair as in a strong uptrend, recording gains of more than 700 pips in the last ten trading days. Nevertheless, the USD/JPY lost 0.19% in one of those ten days and at the time of writing, is down by 0.04%. Also, a negative divergence between price action and the RSI formed and might open the door for a pullback.
That said, the USD/JPY’s first support would be the June 7 low at 132.54. A breach of the latter would expose the June 6 low at 131.84, followed by the May 9 swing high-turned-support at 131.34.
Information on these pages contains forward-looking statements that involve risks and uncertainties. Markets and instruments profiled on this page are for informational purposes only and should not in any way come across as a recommendation to buy or sell in these assets. You should do your own thorough research before making any investment decisions. FXStreet does not in any way guarantee that this information is free from mistakes, errors, or material misstatements. It also does not guarantee that this information is of a timely nature. Investing in Open Markets involves a great deal of risk, including the loss of all or a portion of your investment, as well as emotional distress. All risks, losses and costs associated with investing, including total loss of principal, are your responsibility. The views and opinions expressed in this article are those of the authors and do not necessarily reflect the official policy or position of FXStreet nor its advertisers. The author will not be held responsible for information that is found at the end of links posted on this page.
If not otherwise explicitly mentioned in the body of the article, at the time of writing, the author has no position in any stock mentioned in this article and no business relationship with any company mentioned. The author has not received compensation for writing this article, other than from FXStreet.
FXStreet and the author do not provide personalized recommendations. The author makes no representations as to the accuracy, completeness, or suitability of this information. FXStreet and the author will not be liable for any errors, omissions or any losses, injuries or damages arising from this information and its display or use. Errors and omissions excepted.
The author and FXStreet are not registered investment advisors and nothing in this article is intended to be investment advice.
Recommended content
Editors’ Picks
AUD/USD hung out to dry on familiar low end
AUD/USD tried and failed to spark a bull run during the first trading session of 2025, rising on thin volumes before collapsing back into the 0.6200 handle in the later hours of the day. A broad-market push into the safe haven Greenback kept the Aussie pair on the defensive, and the AUD is mired in congestion on the weak side of two-year lows.
USD/JPY flirts with multi-month highs in the 158.00 region
The USD/JPY pair traded as high as 157.84 on Thursday, nearing the December multi-month high of 158.07. Additional gains are on the docket amid prevalent risk aversion.
Gold flat lines above $2,650 ahead of US PMI release
Gold price consolidates its gains near $2,660 after reaching a two-week high during the early Asian session on Friday. The safe-haven flows amid the geopolitical tensions provide some support to the precious metal.
Could XRP surge to new highs in January 2025? First two days of trading suggest an upside bias
Ripple's XRP is up 7% on Thursday, extending its rally that began during the New Year's Day celebration. If long-term holders continue their recent accumulation, XRP could overcome the $2.9 resistance level and aim for a new all-time high.
Three Fundamentals: Year-end flows, Jobless Claims and ISM Manufacturing PMI stand out Premium
Money managers may adjust their portfolios ahead of the year-end. Weekly US Jobless Claims serve as the first meaningful release in 2025. The ISM Manufacturing PMI provides an initial indication ahead of Nonfarm Payrolls.
Best Forex Brokers with Low Spreads
VERIFIED Low spreads are crucial for reducing trading costs. Explore top Forex brokers offering competitive spreads and high leverage. Compare options for EUR/USD, GBP/USD, USD/JPY, and Gold.