USD/JPY Price Analysis: Remains lackluster below 140.00, Japan’s Inflation in focus


  • USD/JPY is consolidating below 140.00 as investors await Japan’s CPI for further guidance.
  • S&P500 futures have generated some losses ahead of New York's opening, portraying a cautious market mood.
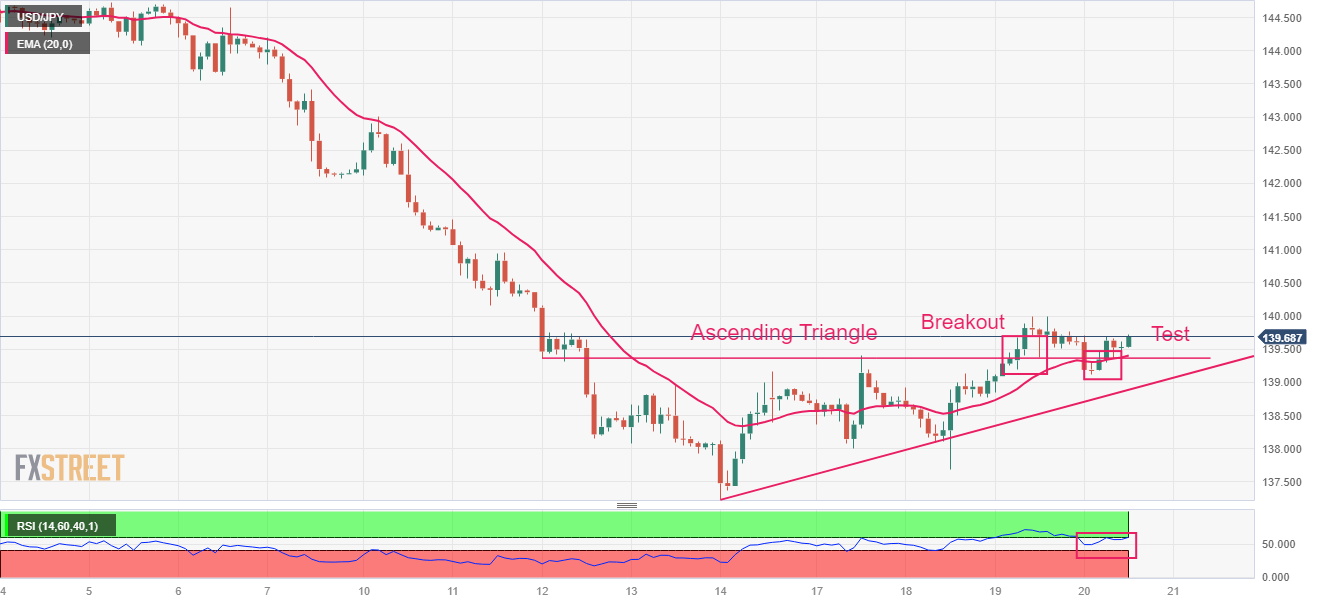
  • USD/JPY has rebounded after testing the breakout of the Ascending Triangle chart pattern.

The USD/JPY pair is demonstrating topsy-turvy moves below the round-level resistance of 140.00 in the London session. The asset is struggling to find a decisive move as investors need guidance about the interest rate decision from the Federal Reserve (Fed) and the Bank of Japan (BoJ), which will be announced next week.

S&P500 futures have generated some losses ahead of New York's opening, portraying a cautious market mood. The US Dollar Index (DXY) has rebounded firmly and is aiming to recapture the previous day’s high of 100.53.

Going forward, Japan’s inflation report for June will be in focus, which will be published on Friday. As per the consensus, the headline Consumer Price Index (CPI) increased to 3.5% vs. the former release of 3.2%. Core inflation that excludes volatile oil and food prices softened marginally to 4.2% against the prior release of 4.3%.

USD/JPY has rebounded after testing the breakout of the Ascending Triangle chart pattern formed on a two-hour scale. A breakout of the aforementioned chart pattern results in wider ticks and heavy volume. The 20-period Exponential Moving Average (EMA) at 139.42 is providing a cushion to the US Dollar bulls.

Meanwhile, the Relative Strength Index (RSI) (14) is attempting a break into the bullish range of 60.00-80.00. An occurrence of the same will activate the bullish momentum.

For an upside move, a decisive break above July 19 high around 140.00 would drive the asset towards June 15 high at 141.50 followed by July 10 high at 143.00.

On the flip side, a downside move below July 18 low of 137.68 would expose the asset to May 17 low at 136.30 and May 12 low at 134.40.

USD/JPY two-hour chart

USD/JPY

Overview
Today last price 139.65
Today Daily Change 0.04
Today Daily Change % 0.03
Today daily open 139.61
 
Trends
Daily SMA20 142.11
Daily SMA50 140.4
Daily SMA100 137.1
Daily SMA200 136.98
 
Levels
Previous Daily High 140
Previous Daily Low 138.77
Previous Weekly High 143
Previous Weekly Low 137.24
Previous Monthly High 145.07
Previous Monthly Low 138.43
Daily Fibonacci 38.2% 139.53
Daily Fibonacci 61.8% 139.24
Daily Pivot Point S1 138.92
Daily Pivot Point S2 138.23
Daily Pivot Point S3 137.69
Daily Pivot Point R1 140.15
Daily Pivot Point R2 140.69
Daily Pivot Point R3 141.38


Share: Feed news

Information on these pages contains forward-looking statements that involve risks and uncertainties. Markets and instruments profiled on this page are for informational purposes only and should not in any way come across as a recommendation to buy or sell in these assets. You should do your own thorough research before making any investment decisions. FXStreet does not in any way guarantee that this information is free from mistakes, errors, or material misstatements. It also does not guarantee that this information is of a timely nature. Investing in Open Markets involves a great deal of risk, including the loss of all or a portion of your investment, as well as emotional distress. All risks, losses and costs associated with investing, including total loss of principal, are your responsibility. The views and opinions expressed in this article are those of the authors and do not necessarily reflect the official policy or position of FXStreet nor its advertisers. The author will not be held responsible for information that is found at the end of links posted on this page.

If not otherwise explicitly mentioned in the body of the article, at the time of writing, the author has no position in any stock mentioned in this article and no business relationship with any company mentioned. The author has not received compensation for writing this article, other than from FXStreet.

FXStreet and the author do not provide personalized recommendations. The author makes no representations as to the accuracy, completeness, or suitability of this information. FXStreet and the author will not be liable for any errors, omissions or any losses, injuries or damages arising from this information and its display or use. Errors and omissions excepted.

The author and FXStreet are not registered investment advisors and nothing in this article is intended to be investment advice.

Open Account
Open Account
Open Account
Open Account
Open Account
Open Account

Recommended content


Recommended content

Editors’ Picks

EUR/USD holds losses near 1.1350 as US Dollar gains on US-China trade optimism

EUR/USD holds losses near 1.1350 as US Dollar gains on US-China trade optimism

EUR/USD consoldiates losses near 1.1350 in European trading on Friday. Broad US Dollar resurgence on optimism surrounding the US-China trade war de-escalation keeps the he pair  undermined. Trade talks and US data remain in focus. 

EUR/USD News
GBP/USD stays pressured near 1.3300 after UK Retail Sales data

GBP/USD stays pressured near 1.3300 after UK Retail Sales data

GBP/USD remains under moderate selling pressure near 1.3300 despite the upbeat UK Retail Sales data for March. The pair feels the heat of the solid US Dollar rebound, aided by a Bloomberg report, which indicated China may suspend its 125% tariff on select US imports. 

GBP/USD News
Gold drops below $3,300 with traders buying into Trump's comments on talks with China

Gold drops below $3,300 with traders buying into Trump's comments on talks with China

Gold price is seeing more profit taking this Friday, erasing all of Thursday’s gains, and looks set to close off this week in the red. The move down comes amid increasing confusion on what is the status of the trade conflict between the United States and China, with the US President giving the impression that talks are taking place and China denying it.

Gold News
Ethereum: Accumulation addresses grab 1.11 million ETH as bullish momentum rises

Ethereum: Accumulation addresses grab 1.11 million ETH as bullish momentum rises

Ethereum saw a 1% decline on Friday as sellers dominated exchange activity in the past 24 hours. Despite the recent selling, increased inflows into accumulation addresses and declining net taker volume show a gradual return of bullish momentum.

Read more
Five fundamentals for the week: Traders confront the trade war, important surveys, key Fed speech

Five fundamentals for the week: Traders confront the trade war, important surveys, key Fed speech Premium

Will the US strike a trade deal with Japan? That would be positive progress. However, recent developments are not that positive, and there's only one certainty: headlines will dominate markets. Fresh US economic data is also of interest.

Read more
The Best brokers to trade EUR/USD

The Best brokers to trade EUR/USD

SPONSORED Discover the top brokers for trading EUR/USD in 2025. Our list features brokers with competitive spreads, fast execution, and powerful platforms. Whether you're a beginner or an expert, find the right partner to navigate the dynamic Forex market.

Read More

Forex MAJORS

Cryptocurrencies

Signatures

Best Brokers of 2025