USD/JPY Price Analysis: Possibility of Key Reversal Day forming
- USD/JPY could be forming a bearish Key Reversal Day.
- A bearish close on Wednesday will validate the one-day pattern.
- It often signifies major peaks and occurred at the highs of the stock market in 2007 prior to the crisis.

USD/JPY is trading back in the lower 151.000s on Wednesday after rising up to a new high of 151.970 during the Asian session, its highest level for decades.
The rapid reversal has been put down to intervention by the Japanese authorities who do not wish to see the Japanese Yen (JPY) depreciate any further.
Such a strong reversal over the course of one day has a special term in technical analysis – it is called a “Key Reversal Day”.
Key Reversal Days are a sign a major reversal in price is on the horizon. It is defined as a day in which price rises up to a new long-term high before rolling over and closing below the low of the previous day (rectangled). The sudden shift in sentiment is indicative of a sea-change in the fundamental outlook for the asset’s price.
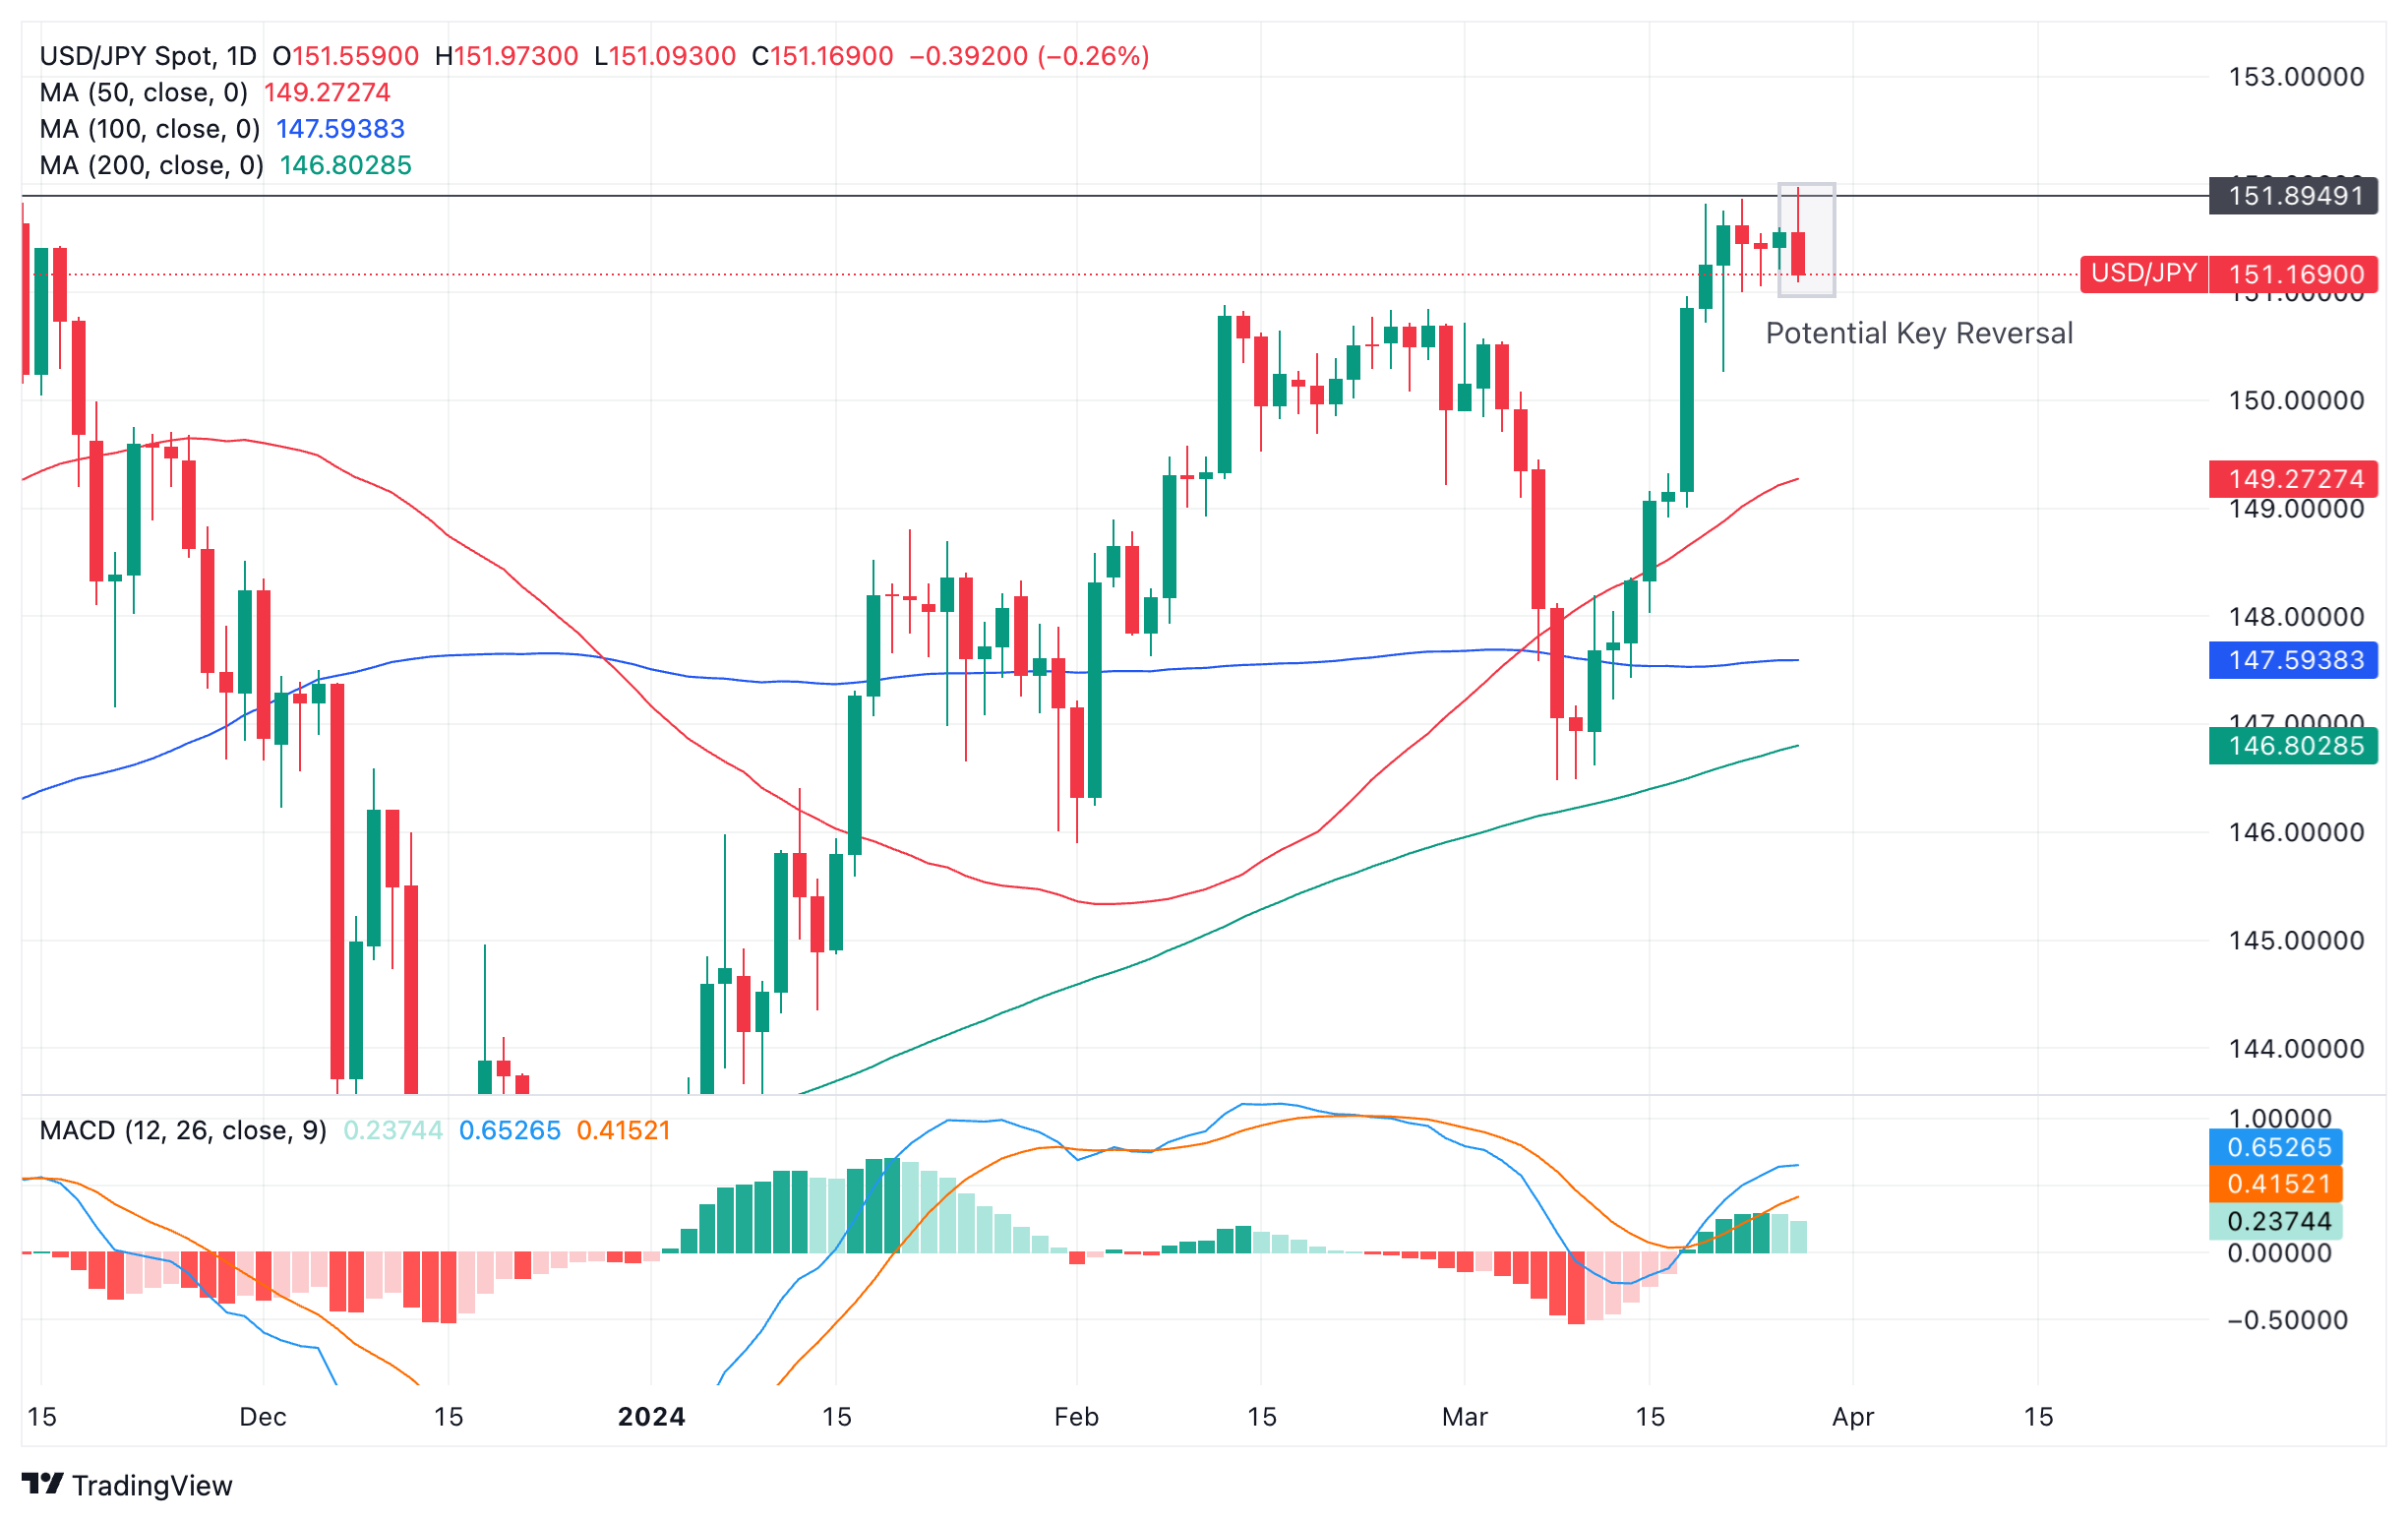
US Dollar versus Japanese Yen: Daily chart
If USD/JPY can maintain its current losses until the end of the day on Wednesday, it will have achieved a Key Reversal Day and may be in line for more losses to come. If it fails to close below Tuesday’s lows at 151.207 it will fail to meet the criteria for a key reversal.
A Key Reversal happened on the S&P 500 index on October 11, 2007 at the peak of the stock market rally just prior to the Great Financial Crisis.
It marked the peak price the S&P 500 achieved before the bear market that followed the banking crisis.
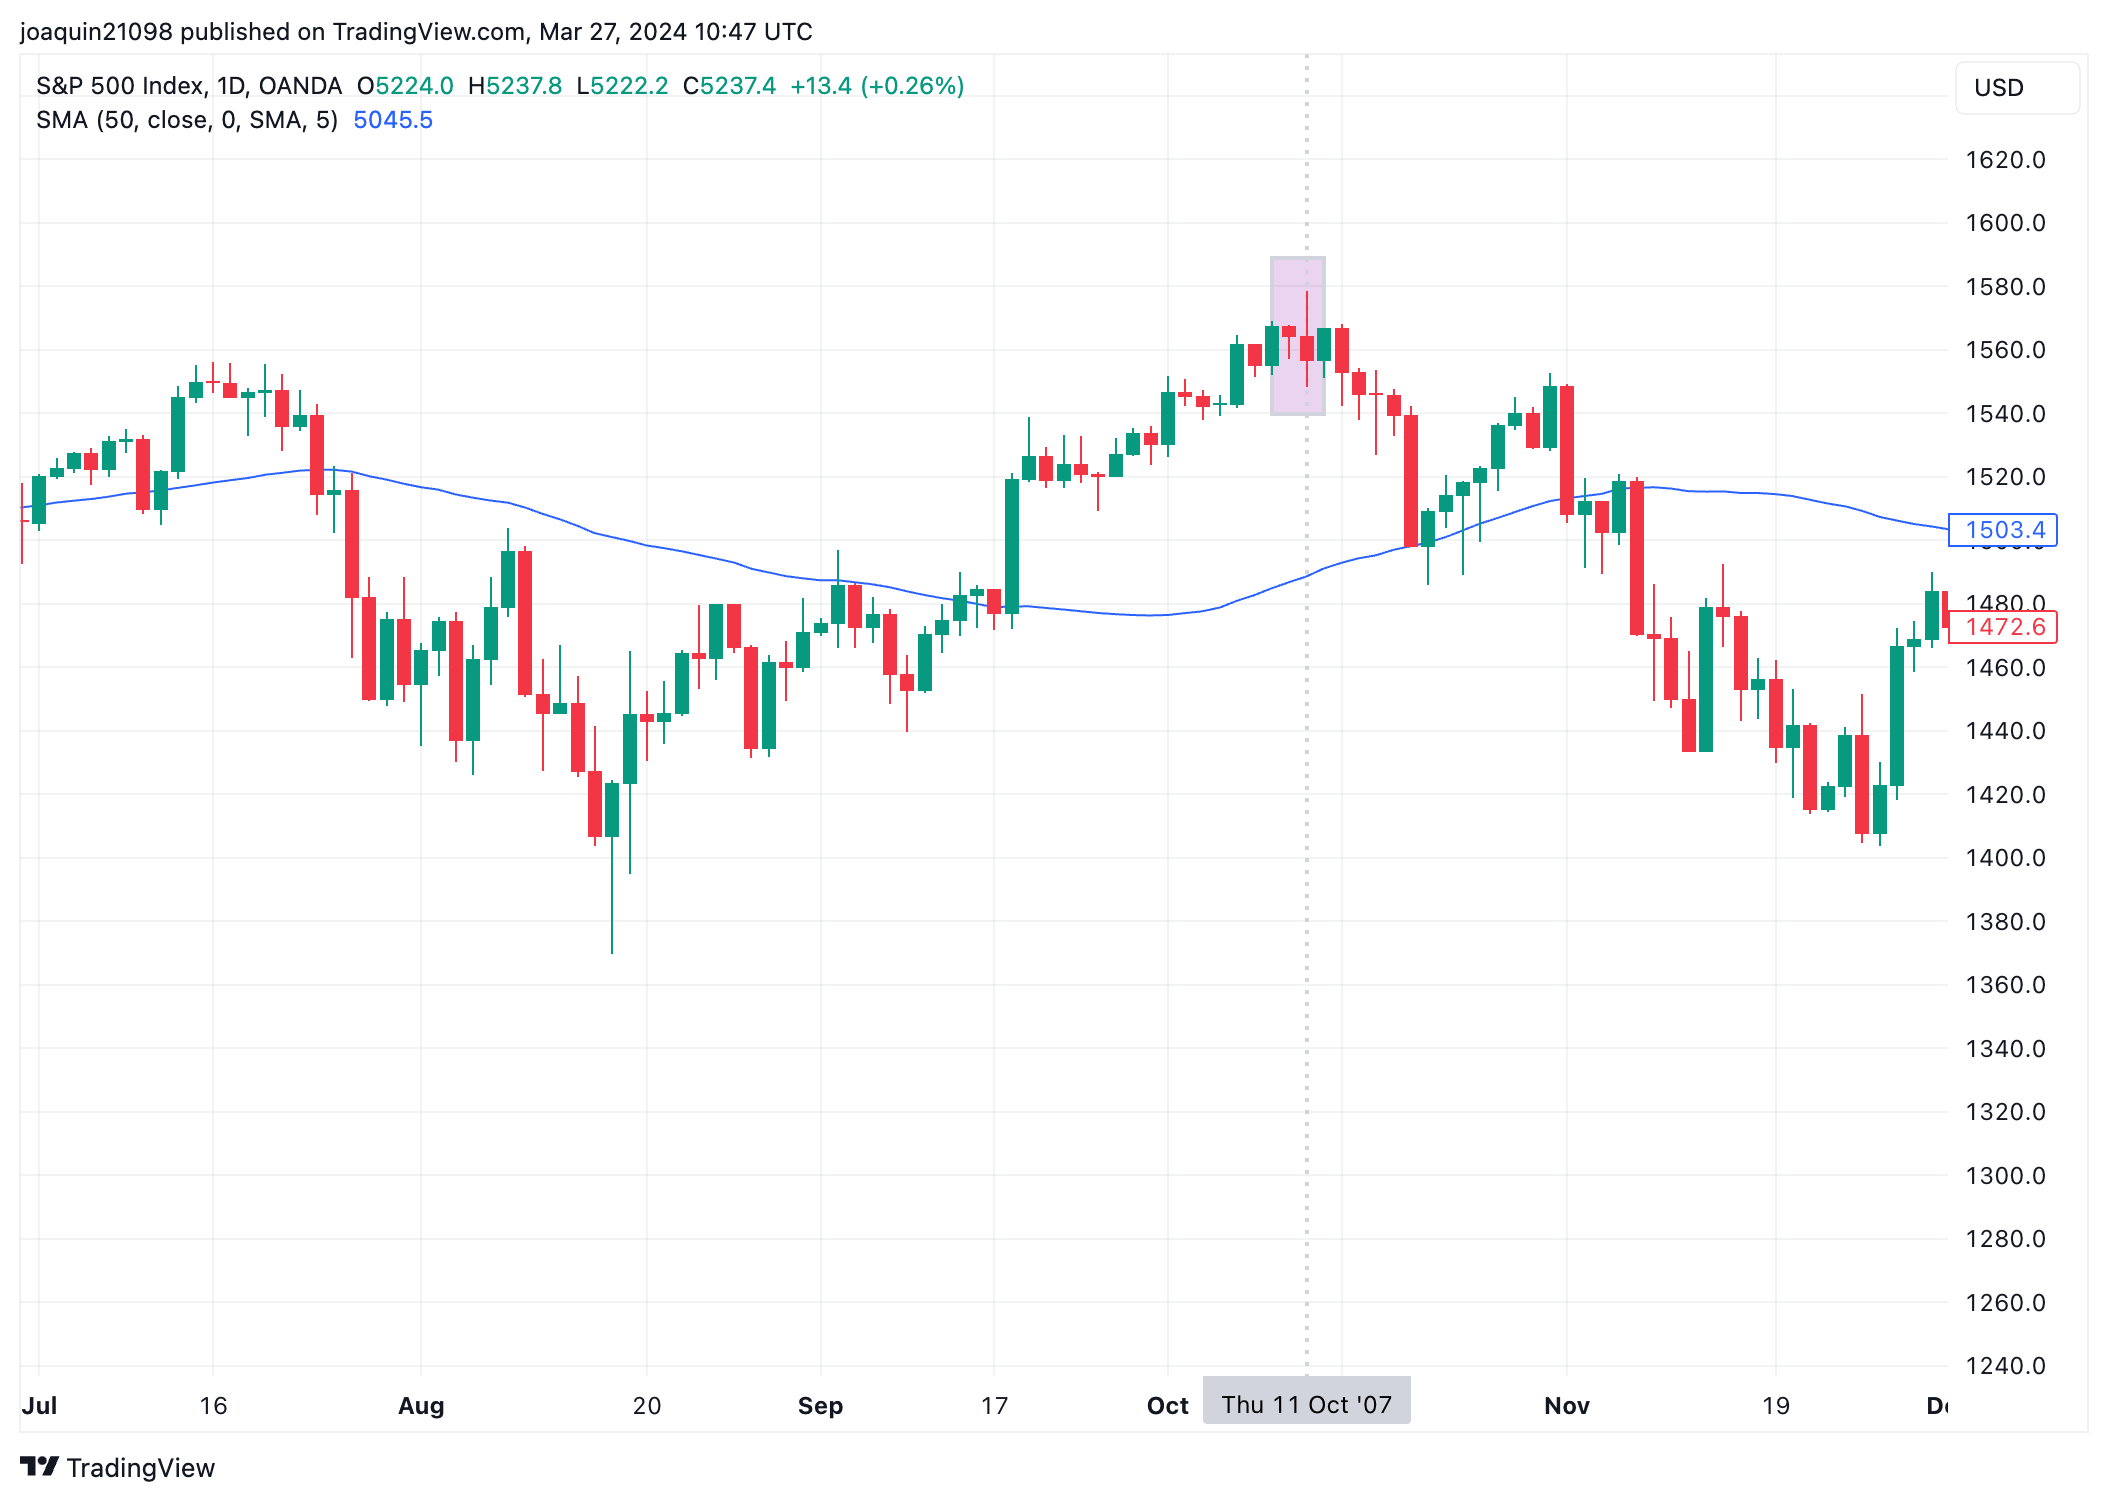
S&P500: Daily chart
Although this subtle though important clue of future weakness largely went unnoticed by most investors, a few technical analysts brought it to attention at the time!
Author

Joaquin Monfort
FXStreet
Joaquin Monfort is a financial writer and analyst with over 10 years experience writing about financial markets and alt data. He holds a degree in Anthropology from London University and a Diploma in Technical analysis.


