USD/JPY Price Analysis: Overbought RSI caps Yen pair’s upside below 140.00


  • USD/JPY buyers struggle to extend latest run-up at the highest levels in six months.
  • Key Fibonacci retracement level, late November 2022 peak prod Yen pair buyers.
  • Multi-day-old previous resistance line, 200-DMA challenges USD/JPY bears amid bullish MACD signals.

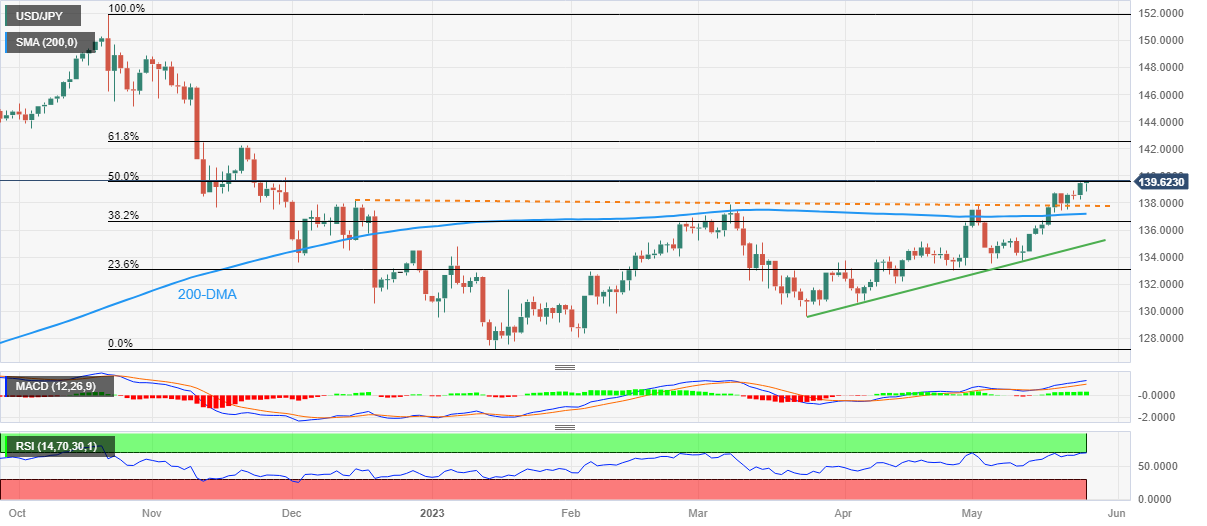
USD/JPY edges higher as it renews the yearly top around 139.65-70 during early Thursday. In doing so, the Yen pair prods the 50% Fibonacci retracement level of its October 2022 to January 2023 downside amid overbought conditions of the RSI (14) line.

Apart from the 50% Fibonacci retracement level surrounding 139.60, the late November 2022 peak of around 139.90, quickly followed by the 140.00 round figure, also challenge the USD/JPY bulls.

In a case where the USD/JPY pair remains firmer past 140.00, the quote’s run-up towards the late November swing high of around 142.25 can’t be ruled out.

Though, the 61.8% Fibonacci retracement level near 142.50, also known as the golden Fibonacci ratio, could challenge the Yen pair buyers afterward.

Meanwhile, USD/JPY pair’s retreat remains elusive unless it breaks the previous resistance line stretched from December 2022, close to 137.80 at the latest.

Following that, the 200-DMA of around 137.20 can challenge the Yen pair sellers before giving them control.

Even so, a two-month-old ascending support line at 134.90 can prod the USD/JPY bears afterward.

Overall, USD/JPY remains on the bull’s radar even if the price is likely to witness a pullback.

USD/JPY: Daily chart

Trend: Limited upside expected

Additional important levels

Overview
Today last price 139.62
Today Daily Change 0.16
Today Daily Change % 0.11%
Today daily open 139.46
 
Trends
Daily SMA20 136.32
Daily SMA50 134.18
Daily SMA100 133.36
Daily SMA200 137.19
 
Levels
Previous Daily High 139.48
Previous Daily Low 138.23
Previous Weekly High 138.75
Previous Weekly Low 135.65
Previous Monthly High 136.56
Previous Monthly Low 130.63
Daily Fibonacci 38.2% 139
Daily Fibonacci 61.8% 138.71
Daily Pivot Point S1 138.64
Daily Pivot Point S2 137.81
Daily Pivot Point S3 137.39
Daily Pivot Point R1 139.88
Daily Pivot Point R2 140.3
Daily Pivot Point R3 141.13


Share: Feed news

Information on these pages contains forward-looking statements that involve risks and uncertainties. Markets and instruments profiled on this page are for informational purposes only and should not in any way come across as a recommendation to buy or sell in these assets. You should do your own thorough research before making any investment decisions. FXStreet does not in any way guarantee that this information is free from mistakes, errors, or material misstatements. It also does not guarantee that this information is of a timely nature. Investing in Open Markets involves a great deal of risk, including the loss of all or a portion of your investment, as well as emotional distress. All risks, losses and costs associated with investing, including total loss of principal, are your responsibility. The views and opinions expressed in this article are those of the authors and do not necessarily reflect the official policy or position of FXStreet nor its advertisers. The author will not be held responsible for information that is found at the end of links posted on this page.

If not otherwise explicitly mentioned in the body of the article, at the time of writing, the author has no position in any stock mentioned in this article and no business relationship with any company mentioned. The author has not received compensation for writing this article, other than from FXStreet.

FXStreet and the author do not provide personalized recommendations. The author makes no representations as to the accuracy, completeness, or suitability of this information. FXStreet and the author will not be liable for any errors, omissions or any losses, injuries or damages arising from this information and its display or use. Errors and omissions excepted.

The author and FXStreet are not registered investment advisors and nothing in this article is intended to be investment advice.

Recommended content


Recommended content

Editors’ Picks

EUR/USD retreats from daily highs, holds above 1.0800

EUR/USD retreats from daily highs, holds above 1.0800

EUR/USD loses traction but holds above 1.0800 after touching its highest level in three weeks above 1.0840. Nonfarm Payrolls in the US rose more than expected in June but downward revisions to May and April don't allow the USD to gather strength.

EUR/USD News

GBP/USD struggles to hold above 1.2800 after US jobs data

GBP/USD struggles to hold above 1.2800 after US jobs data

GBP/USD spiked above 1.2800 with the immediate reaction to the mixed US jobs report but retreated below this level. Nonfarm Payrolls in the US rose 206,000 in June. The Unemployment Rate ticked up to 4.1% and annual wage inflation declined to 3.9%. 

GBP/USD News

Gold approaches $2,380 on robust NFP data

Gold approaches $2,380 on robust NFP data

Gold intensifies the bullish stance for the day, rising to the vicinity of the $2,380 region following the publication of the US labour market report for the month of June. The benchmark 10-year US Treasury bond yield stays deep in the red near 4.3%, helping XAU/USD push higher.

Gold News

Crypto Today: Bitcoin, Ethereum and Ripple lose key support levels, extend declines on Friday

Crypto Today: Bitcoin, Ethereum and Ripple lose key support levels, extend declines on Friday

Crypto market lost nearly 6% in market capitalization, down to $2.121 trillion. Bitcoin (BTC), Ethereum (ETH) and Ripple (XRP) erased recent gains from 2024. 

Read more

French Elections Preview: Euro to “sell the fact” on a hung parliament scenario Premium

French Elections Preview: Euro to “sell the fact” on a hung parliament scenario

Investors expect Frances's second round of parliamentary elections to end with a hung parliament. Keeping extremists out of power is priced in and could result in profit-taking on Euro gains. 

Read more

Forex MAJORS

Cryptocurrencies

Signatures