• Long-term, the USD/JPY is neutral-to-upward biased, facing solid resistance at 135.50.
  • The USD/JPY hourly chart portrays a 40 pip narrow trading range ahead of Wednesday’s US CPI report.

The USD/JPY is almost flat amidst a calmed North American session ahead of July’s US inflation report, which could shed light on further Federal Reserve tightening in the September meeting. At the time of writing, the USD/JPY is trading at 135.12, slightly up 0.14%.

USD/JPY Price Analysis: Technical outlook

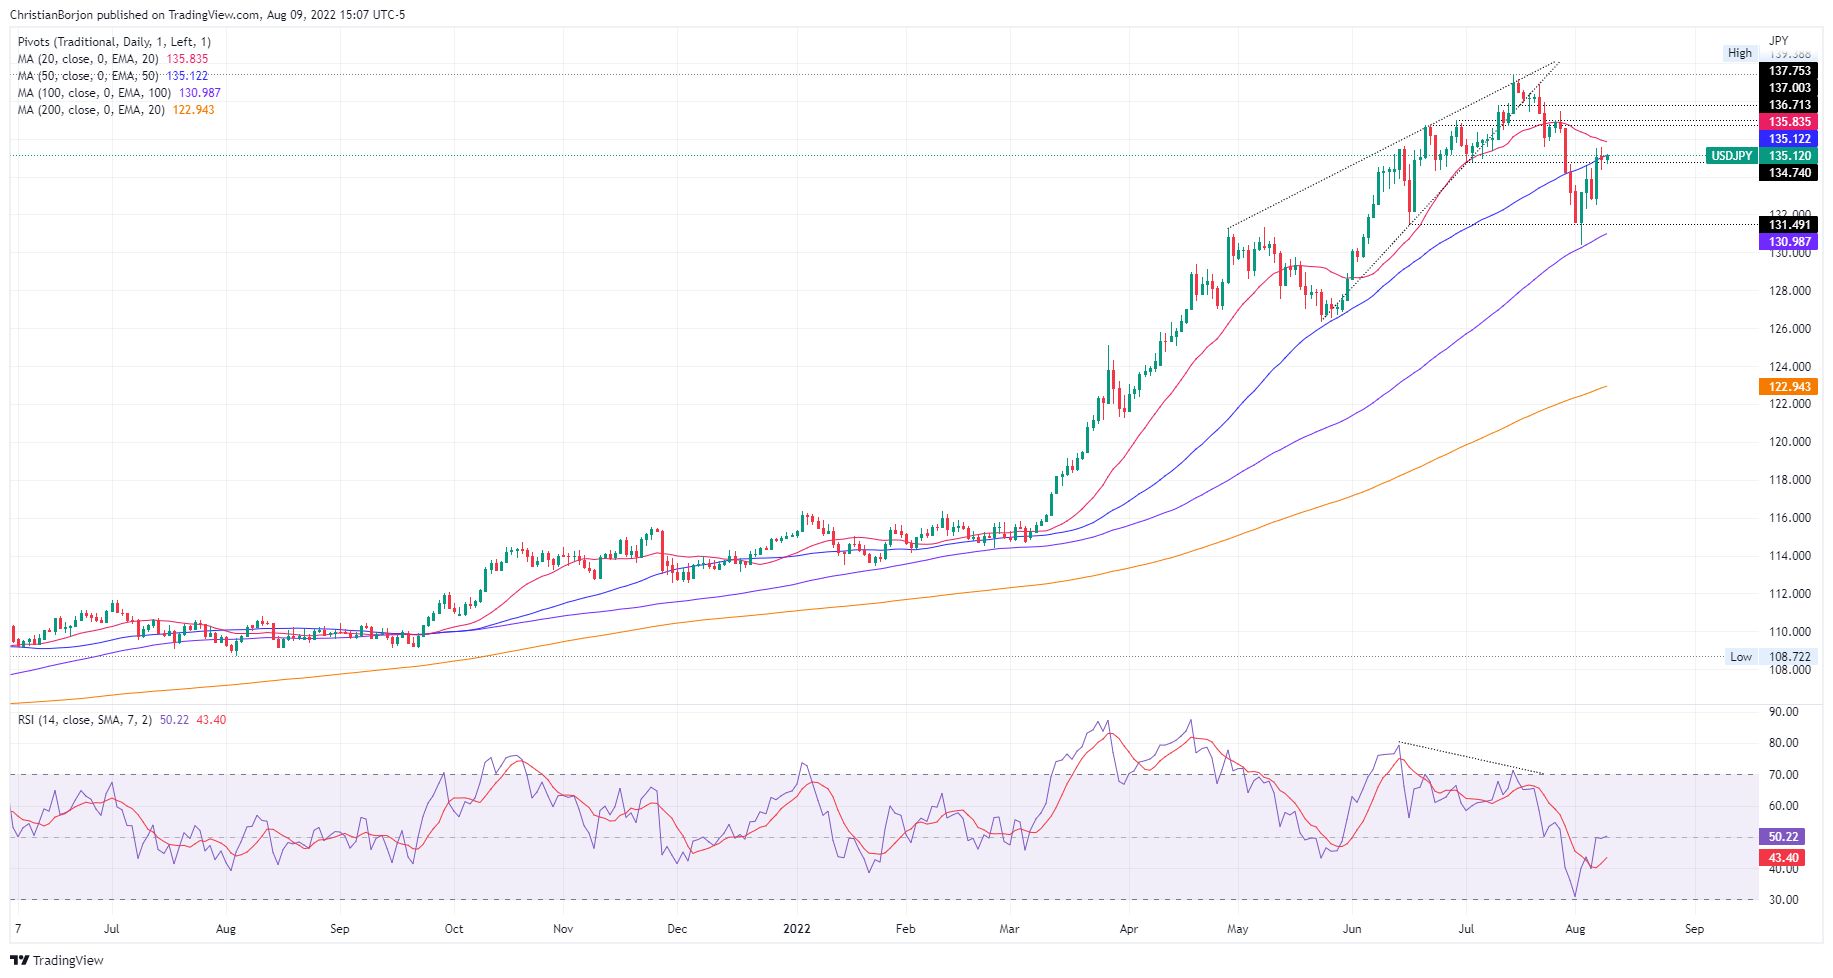
The USD/JPY daily chart portrays the pair as neutral-to-upward biased. In the last couple of days, the pair’s price action faced solid resistance around the 135.50 area, putting a lid on the USD/JPY, while the Relative Strength Index (RSI) at 50.32 sideways illustrates the consolidation in the pair.

If the USD/JPY breaks above 135.50, the next resistance would be the 20-day EMA at 135.83. Once cleared, the next resistance would be the July 28 high at 136.57, followed by 137.00. On the flip side, the USD/JPY first support would be the 50-day EMA at 135.12. Break below will expose the 135.00 figure, followed by the August 5 daily low at 132.52.

USD/JPY Daily chart

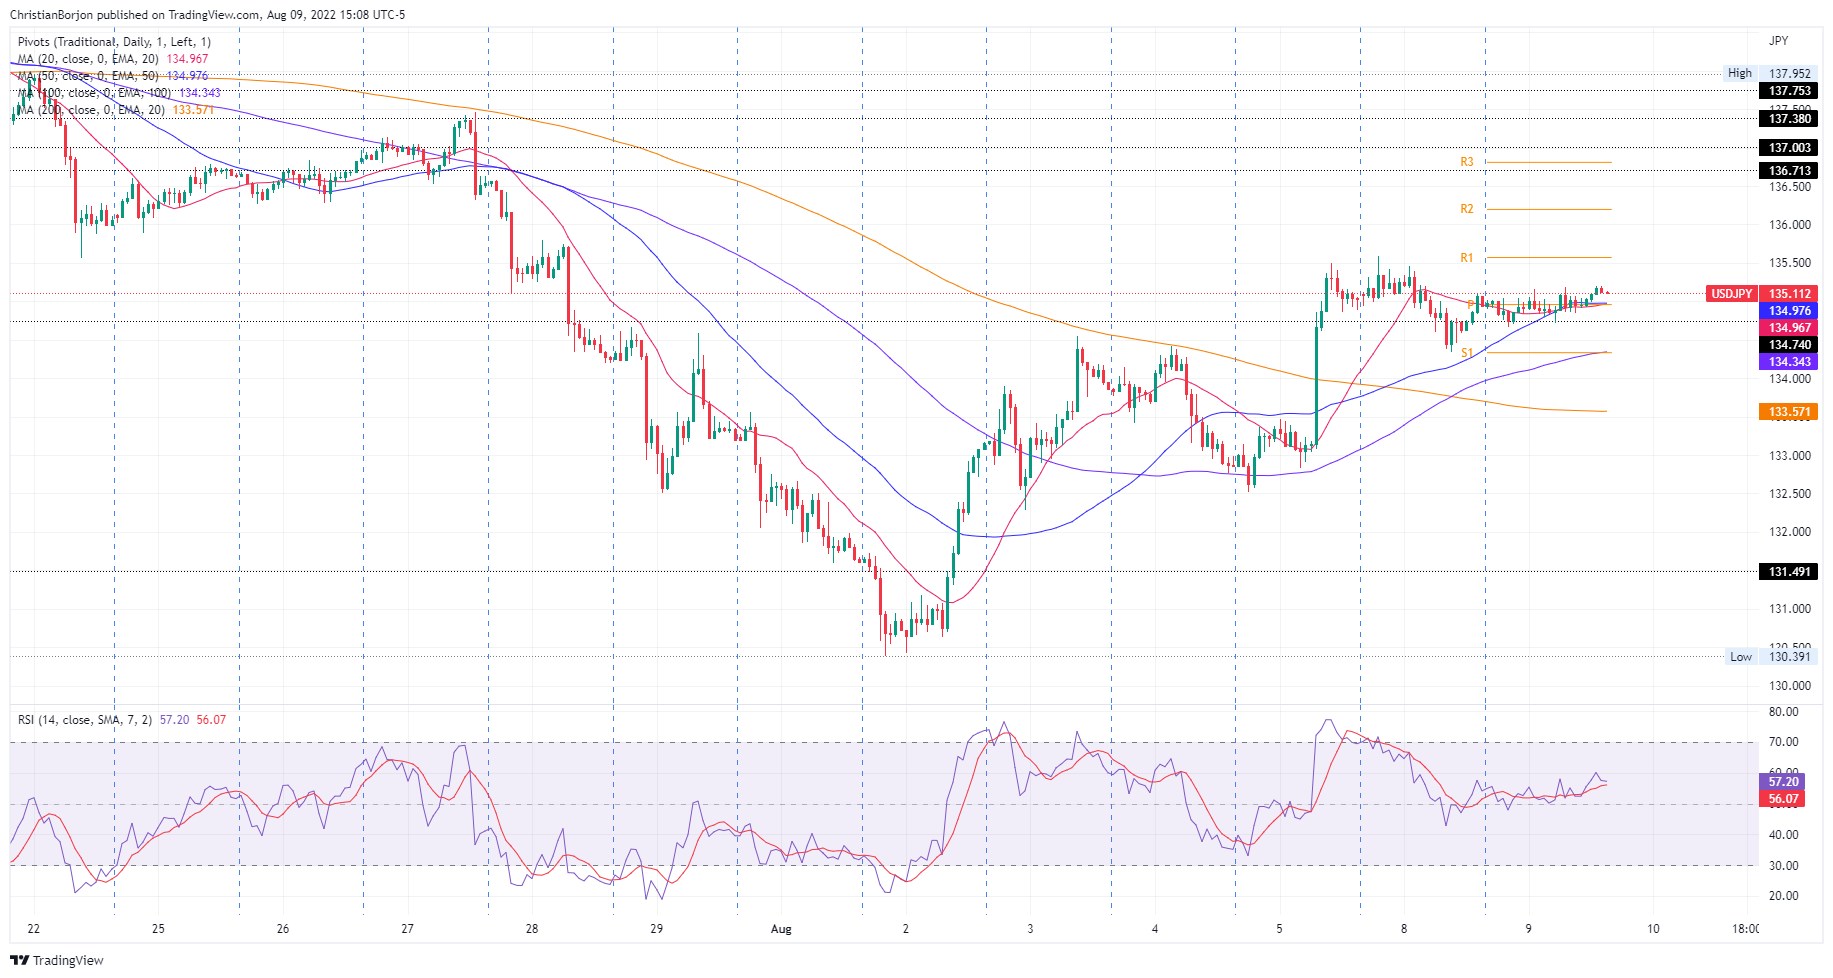
From a near-term perspective, the one-hour USD/JPY chart illustrates Tuesday’s price action’s narrow 40 pip range. The 20 and 50-hour EMAs around the 134.95-97 area cement the previously mentioned, signaling that USD/JPY traders remain at bay, waiting for fresh US economic data, namely inflation. Therefore, a break above/below that range would determine the faith of the major.

Upwards, the USD/JPY’s first resistance would be the 135.50 mark. A breach of the latter will expose the July 27 daily high at 136.58, followed by 137.00. Downwards, the USD/JPY’s first support will be the August 8 daily low at 134.75. Once cleared, the next support will be the 200-hour EMA at 133.57.

USD/JPY Hourly chart

USD/JPY Key Technical Levels

USD/JPY

Overview
Today last price 135.12
Today Daily Change 0.23
Today Daily Change % 0.17
Today daily open 134.89
 
Trends
Daily SMA20 135.95
Daily SMA50 135.02
Daily SMA100 130.87
Daily SMA200 122.86
 
Levels
Previous Daily High 135.58
Previous Daily Low 134.35
Previous Weekly High 135.5
Previous Weekly Low 130.4
Previous Monthly High 139.39
Previous Monthly Low 132.5
Daily Fibonacci 38.2% 134.82
Daily Fibonacci 61.8% 135.11
Daily Pivot Point S1 134.3
Daily Pivot Point S2 133.71
Daily Pivot Point S3 133.06
Daily Pivot Point R1 135.53
Daily Pivot Point R2 136.18
Daily Pivot Point R3 136.77


Share: Feed news

Information on these pages contains forward-looking statements that involve risks and uncertainties. Markets and instruments profiled on this page are for informational purposes only and should not in any way come across as a recommendation to buy or sell in these assets. You should do your own thorough research before making any investment decisions. FXStreet does not in any way guarantee that this information is free from mistakes, errors, or material misstatements. It also does not guarantee that this information is of a timely nature. Investing in Open Markets involves a great deal of risk, including the loss of all or a portion of your investment, as well as emotional distress. All risks, losses and costs associated with investing, including total loss of principal, are your responsibility. The views and opinions expressed in this article are those of the authors and do not necessarily reflect the official policy or position of FXStreet nor its advertisers. The author will not be held responsible for information that is found at the end of links posted on this page.

If not otherwise explicitly mentioned in the body of the article, at the time of writing, the author has no position in any stock mentioned in this article and no business relationship with any company mentioned. The author has not received compensation for writing this article, other than from FXStreet.

FXStreet and the author do not provide personalized recommendations. The author makes no representations as to the accuracy, completeness, or suitability of this information. FXStreet and the author will not be liable for any errors, omissions or any losses, injuries or damages arising from this information and its display or use. Errors and omissions excepted.

The author and FXStreet are not registered investment advisors and nothing in this article is intended to be investment advice.

Recommended content


Recommended content

Editors’ Picks

EUR/USD tests fresh tops above 1.0870 on NFP

EUR/USD tests fresh tops above 1.0870 on NFP

The selling bias in the US Dollar gathers extra pace on Friday after the US economy created fewer jobs than initially estimated in February, sending EUR/USD to the area of new highs around 1.0870.

EUR/USD News
GBP/USD hovers around recent highs above 1.2900

GBP/USD hovers around recent highs above 1.2900

The continuation of the downward trend in the Greenback encourages GBP/USD to maintain the trade just above the 1.2900 mark following the release of US NFP in February.

GBP/USD News
Gold remains bid above $2,900 after US Payrolls

Gold remains bid above $2,900 after US Payrolls

Gold prices manage to leave behind Thursday’s pullback and revisits the area of $2,920 per troy ounce in the wake of the publication of the US labour market report in February.

Gold News
White House Crypto Summit could boost adoption across financial markets: Binance exec Rachel Conlan

White House Crypto Summit could boost adoption across financial markets: Binance exec Rachel Conlan

US President Donald Trump signed an executive order for a Strategic Bitcoin Reserve on Friday, shifting industry leaders’ focus from regulation to adoption. Within just over six weeks of his term, the President is set to host the first Crypto Summit, hosting industry giants and executives from the ecosystem. 

Read more
February CPI preview: The tariff winds start to blow

February CPI preview: The tariff winds start to blow

Consumer price inflation came out of the gate strong in 2025, but price growth looks to have cooled somewhat in February. We estimate headline CPI rose 0.25% and the core index advanced 0.27%. The moderation in the core index is likely to reflect some giveback in a handful of categories that soared in January.

Read more
The Best brokers to trade EUR/USD

The Best brokers to trade EUR/USD

SPONSORED Discover the top brokers for trading EUR/USD in 2025. Our list features brokers with competitive spreads, fast execution, and powerful platforms. Whether you're a beginner or an expert, find the right partner to navigate the dynamic Forex market.

Read More

Forex MAJORS

Cryptocurrencies

Signatures

Best Brokers of 2025