- USD/JPY gains some positive traction on Wednesday and climbs back closer to the weekly high.
- The formation of a bearish flag pattern warrants caution before positioning for any further upside.
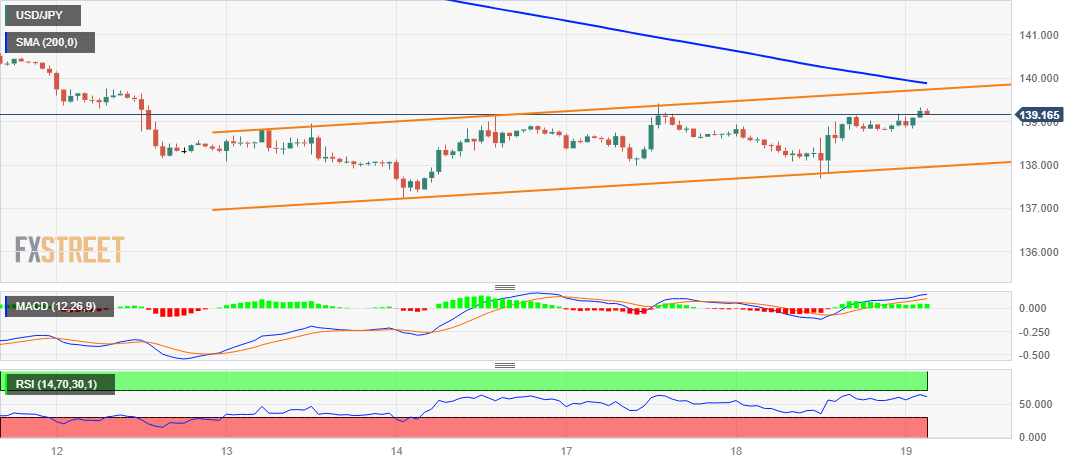
- A convincing break below the trend-channel support is needed to reaffirm the negative outlook.
The USD/JPY pair edges higher on Wednesday and climbs back above the 139.00 mark during the Asian session, back closer to the top boundary of its weekly range. Spot prices currently trade around the 139.20 region, up over 0.25% for the day, though the technical setup remains tilted in favour of bearish traders and warrants caution before positioning for any meaningful upside in the near term.
The prevalent risk-on environment, along with less hawkish remarks by Bank of Japan (BOJ) Governor Kazuo Ueda, saying that there was still some distance to sustainably achieve the 2% inflation target, undermines the safe-haven Japanese Yen (JPY). Apart from this, a modest US Dollar (USD) uptick is seen as a key factor lending some support to the USD/JPY pair. That said, rising bets that the Federal Reserve (Fed) is nearing the end of its current rate-hiking cycle hold back the USD bulls from placing aggressive bets and act as a tailwind for the major.
From a technical perspective, the recent recovery from the vicinity of a confluence comprising technically significant Simple Moving Averages (100-day and 200-day SMAs) has been along an upward-sloping channel. Against the backdrop of the recent sharp retracement slide from levels just above the 145.00 mark, or the YTD peak touched in June, the said channel constitutes the formation of a bearish flag pattern. Furthermore, oscillators on the daily chart are holding deep in the negative territory and validate the negative outlook for the USD/JPY pair.
Hence, any subsequent move up is more likely to confront stiff resistance near the top boundary of the aforementioned trend channel, currently around the 139.70 region. This is closely followed by the 200-hour SMA, just ahead of the 140.00 psychological mark, which if cleared decisively will negate the bearish setup and prompt aggressive short-covering move. The USD/JPY pair might then accelerate the recovery momentum towards the 140.45-140.50 intermediate hurdle en route to the 141.00 round figure and the 141.25-141.300 supply zone.
On the flip side, sustained weakness back below the 139.00 mark now seems to attract some buyers near the 138.40-138.35 region ahead of the 138.00 mark, which coincides with the trend-channel support. Some follow-through selling below the weekly low, around the 137.70-137.65 region touched on Tuesday, will confirm the bearish flag breakdown and expose the 100-day/200-day SMAs confluence, near the 137.00 level. Spot prices might then turn vulnerable to prolonging the recent downward trajectory witnessed over the past two weeks or so.
USD/JPY 1-hour chart
Key levelsto watch
Information on these pages contains forward-looking statements that involve risks and uncertainties. Markets and instruments profiled on this page are for informational purposes only and should not in any way come across as a recommendation to buy or sell in these assets. You should do your own thorough research before making any investment decisions. FXStreet does not in any way guarantee that this information is free from mistakes, errors, or material misstatements. It also does not guarantee that this information is of a timely nature. Investing in Open Markets involves a great deal of risk, including the loss of all or a portion of your investment, as well as emotional distress. All risks, losses and costs associated with investing, including total loss of principal, are your responsibility. The views and opinions expressed in this article are those of the authors and do not necessarily reflect the official policy or position of FXStreet nor its advertisers. The author will not be held responsible for information that is found at the end of links posted on this page.
If not otherwise explicitly mentioned in the body of the article, at the time of writing, the author has no position in any stock mentioned in this article and no business relationship with any company mentioned. The author has not received compensation for writing this article, other than from FXStreet.
FXStreet and the author do not provide personalized recommendations. The author makes no representations as to the accuracy, completeness, or suitability of this information. FXStreet and the author will not be liable for any errors, omissions or any losses, injuries or damages arising from this information and its display or use. Errors and omissions excepted.
The author and FXStreet are not registered investment advisors and nothing in this article is intended to be investment advice.
Recommended content
Editors’ Picks

EUR/USD holds steady above 1.0800, looks to post weekly losses
EUR/USD trades marginally higher on the day above 1.0800 after the data from the US showed that Durable Goods Orders declined by 0.8% in September. Nevertheless, the pair remains on track to close the fourth consecutive week in negative territory.

GBP/USD extends recovery to 1.3000 area
GBP/USD extends its recovery and trades at around 1.3000 in the American session on Friday. The US Dollar struggles to gather strength as the market mood remains positive heading into the weekend, allowing the pair to hold its ground.

Gold fluctuates in narrow range below $2,750
Gold stays in a consolidation phase and fluctuates in a relatively tight range below $2,750 on Friday. US Treasury bond yields stabilize in the American session, making it difficult for XAU/USD to gather directional momentum.

Crypto Today: XRP, Bitcoin and Ethereum decline as Ripple files response to SEC appeal
XRP loses over 1.30% as Ripple's executive confirms the filing of an important document in the appeals process in the SEC lawsuit. Bitcoin corrects less than 1% and sustains above $67,500. Ethereum is down nearly 0.20%, holding above the key support level of $2,500.

US elections: The race to the White House tightens
Trump closes in on Harris’s lead in the polls. Neck and neck race spurs market jitters. Outcome still hinges on battleground states.

Best Forex Brokers with Low Spreads
VERIFIED Low spreads are crucial for reducing trading costs. Explore top Forex brokers offering competitive spreads and high leverage. Compare options for EUR/USD, GBP/USD, USD/JPY, and Gold.