- USD/JPY seems vulnerable above 139.00 as the USD Index is losing its charm.
- BoJ Ueda said the central bank will discuss specifics of an exit policy when achievement of the price target is foreseen.
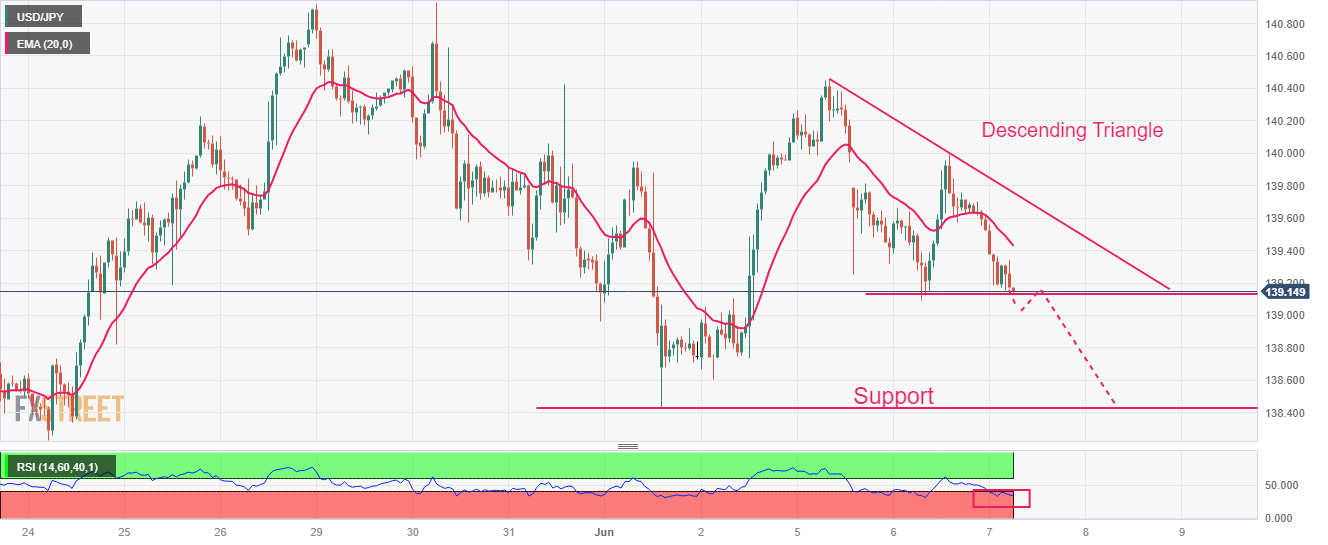
- USD/JPY is expected to display a sheer downside after a breakdown of the Descending Triangle pattern.
The USD/JPY pair is juggling in a narrow range above the crucial support of 139.00 in the Asian session. The asset seems vulnerable above the aforementioned support as the US Dollar Index is losing its charm. Where major central banks are gearing up for a fresh interest rate hike, investors are anticipating that the Federal Reserve (Fed) could pause its policy-tightening spell as the impact of interest rate hikes yet made has not passed.
The US Dollar Index (DXY) has witnessed some support after correcting to near 104.00. A squeeze in volatility for the USD Index is anticipated amid an absence of potential economic events this week.
Meanwhile, the Japanese yen has got some strength as Bank of Japan (BoJ) Governor Kazuo Ueda said on Wednesday, “When achievement of price target is foreseen, we will discuss specifics of an exit policy and disclose information as needed.”
USD/JPY is on the verge of delivering a breakdown of the Descending Triangle chart pattern formed on an hourly scale. A breakdown of the aforementioned pattern results in wider ticks and heavy volume.
Declining 20-period Exponential Moving Average (EMA) at 139.43 adds to the downside filters.
The Relative Strength Index (RSI) (14) has shifted into the bearish range of 20.00-40.00, which indicates that downside momentum has been triggered.
A confident break below June 06 low at 139.09 will drag the asset toward March 08 high at 137.92 followed by March 02 high at 137.10
On the flip side, a break above May 31 high at 140.42 will drive the asset toward May 30 high at 140.93. A break above the latter will expose the asset to a fresh six-month high of around 141.61, which is 23 November 2022 high.
USD/JPY hourly chart
Information on these pages contains forward-looking statements that involve risks and uncertainties. Markets and instruments profiled on this page are for informational purposes only and should not in any way come across as a recommendation to buy or sell in these assets. You should do your own thorough research before making any investment decisions. FXStreet does not in any way guarantee that this information is free from mistakes, errors, or material misstatements. It also does not guarantee that this information is of a timely nature. Investing in Open Markets involves a great deal of risk, including the loss of all or a portion of your investment, as well as emotional distress. All risks, losses and costs associated with investing, including total loss of principal, are your responsibility. The views and opinions expressed in this article are those of the authors and do not necessarily reflect the official policy or position of FXStreet nor its advertisers. The author will not be held responsible for information that is found at the end of links posted on this page.
If not otherwise explicitly mentioned in the body of the article, at the time of writing, the author has no position in any stock mentioned in this article and no business relationship with any company mentioned. The author has not received compensation for writing this article, other than from FXStreet.
FXStreet and the author do not provide personalized recommendations. The author makes no representations as to the accuracy, completeness, or suitability of this information. FXStreet and the author will not be liable for any errors, omissions or any losses, injuries or damages arising from this information and its display or use. Errors and omissions excepted.
The author and FXStreet are not registered investment advisors and nothing in this article is intended to be investment advice.


Recommended content
Editors’ Picks

Gold climbs to new all-time high above $3,400
Gold extends its uptrend and trades at a new all-time high above $3,400 on Monday. Concerns over US-China trade war escalation and the Fed’s independence smash the US Dollar to three-year troughs, fuelling XAU/USD's rally.

EUR/USD clings to strong gains above 1.1500 on persistent USD weakness
EUR/USD gains more than 1% on the day and trades at its highest level since November 2021 above 1.1500. The relentless US Dollar selling helps the pair push higher as fears over a US economic recession and the Federal Reserve’s autonomy grow.

GBP/USD tests 1.3400 as USD selloff continues
GBP/USD continues its winning streak, testing 1.3400 on Monday. The extended US Dollar weakness, amid US-Sino trade war-led recession fears and heightened threat to the Fed's independence, underpin the pair following the long weekend.

How to make sense of crypto recovery – Is it a buy or fakeout
Bitcoin (BTC), Ethereum (ETH) and XRP, the top three cryptocurrencies by market capitalization, extend their last week’s recovery on Monday, even as trader sentiment is hurt by the US President Donald Trump’s tariff policy and announcements.

Five fundamentals for the week: Traders confront the trade war, important surveys, key Fed speech Premium
Will the US strike a trade deal with Japan? That would be positive progress. However, recent developments are not that positive, and there's only one certainty: headlines will dominate markets. Fresh US economic data is also of interest.

The Best brokers to trade EUR/USD
SPONSORED Discover the top brokers for trading EUR/USD in 2025. Our list features brokers with competitive spreads, fast execution, and powerful platforms. Whether you're a beginner or an expert, find the right partner to navigate the dynamic Forex market.