|

USD/JPY Price Analysis: Lack of a catalyst keeps the pair sideways in the 135.00-136.00 area

  • The USD/JPY has been trading in a choppy 100 pip range for the last five days.
  • The major seesawed spurred by the assassination of Japan’s ex-PM Abe and upbeat US economic data.
  • USD/JPY Price Analysis: Range-bound, but the RSI’s aiming lower and USD/JPY uptrend overextended, might pave the way for further downside.

USD/JPY is subdued as the North American session winds down, consolidating in the 135.00-136.00 range amidst the lack of a catalyst that could trigger an upward/downward break of the previously-mentioned area after news of the assassination of the Japanese ex-Prime Minister Shinzo Abe.

The USD/JPY began the last day of the week trading around 136.00, followed by an aggressive fall toward 135.32 on the breaking news of the attack on Shinzo Abe. However, favorable US employment data lifted the major towards the weekly high around 136.56 before retreating toward current levels. At the time of writing, the USD/JPY is trading at 136.04.
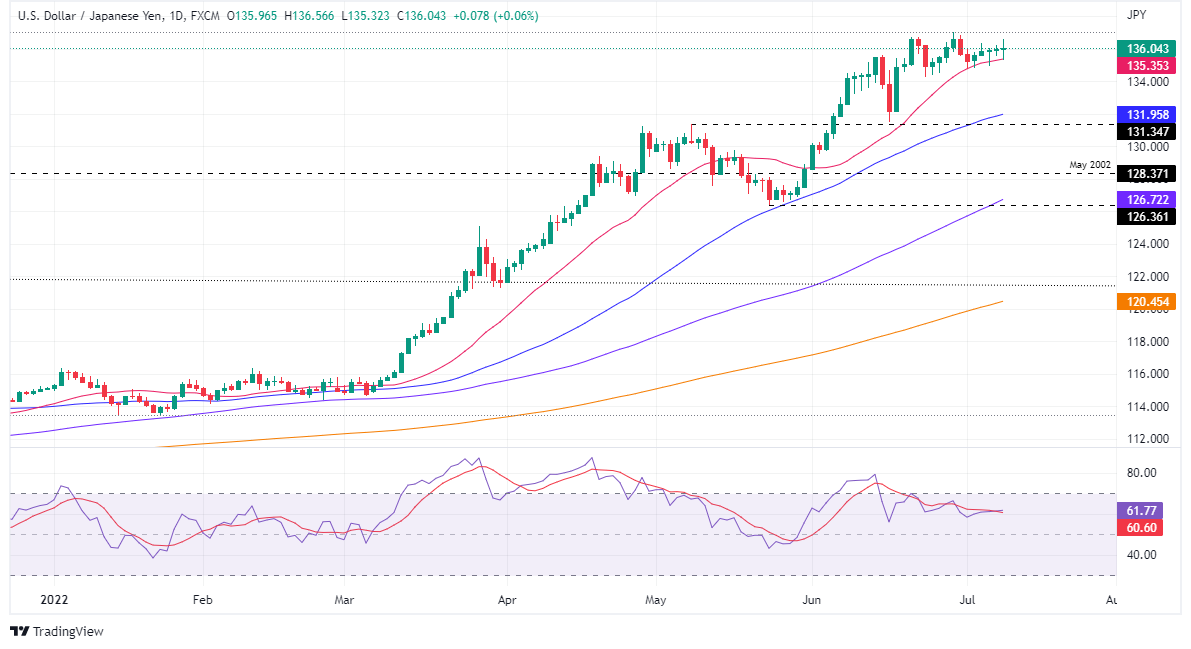
USD/JPY Daily chart

The USD/JPY daily chart illustrates that the price is overextended and the uptrend has lost steam. However, USDJPY sellers’ failure to break below the 20-day EMA at 135.35 has exposed the pair to some upside pressure, but the Relative Strenght Index (RSI) at 41.89 begins to aim downwards, meaning that a pullback might be on the cards.

That said, the USD/JPY first support would be136.00. Break below will expose the 20-day EMA, followed by the June 23 daily low at 134.26, followed by 50-day EMA at 131.95.

USD/JPY Key Technical Levels

USD/JPY

Overview
Today last price136.04
Today Daily Change0.07
Today Daily Change %0.05
Today daily open136
 
Trends
Daily SMA20135.3
Daily SMA50131.86
Daily SMA100126.54
Daily SMA200120.35
 
Levels
Previous Daily High136.22
Previous Daily Low135.55
Previous Weekly High137
Previous Weekly Low134.52
Previous Monthly High137
Previous Monthly Low128.65
Daily Fibonacci 38.2%135.96
Daily Fibonacci 61.8%135.81
Daily Pivot Point S1135.63
Daily Pivot Point S2135.26
Daily Pivot Point S3134.96
Daily Pivot Point R1136.3
Daily Pivot Point R2136.59
Daily Pivot Point R3136.96

Author

Christian Borjon Valencia

Markets analyst, news editor, and trading instructor with over 14 years of experience across FX, commodities, US equity indices, and global macro markets.

More from Christian Borjon Valencia
Share:

Editor's Picks

EUR/USD looks to regain the 200-day SMA

EUR/USD regains some balance and trade just above 1.1600 the figure ahead of the opening bell in Asia. The pair initially dipped to the 1.1530 zone for the first time since November, always following the stronger US Dollar and the marked flight-to-safety in the context of the ongoing Middle East crisis
 

GBP/USD attacks 1.3300, refreshing three-month lows

GBP/USD is deep in the red near 1.3300, accelerating its downside to renew three-month lows in European trading on Tuesday. The ongoing escalation in the Iran war, combined with rising Oil prices, weighs negatively on the higher-yielding Pound Sterling as the US Dollar capitalizes on increased haven demand.

Gold bounces off lows, back above $5,100

Gold remains on the defensive, eroding part of the recent multi-day advance and managing to trade back above the $5,100 mark per troy ounce on Tuesday. The precious metal initially dropped just below the critical $5,000 threshold on the back of the persistent strength of the Greenback, higher US Treasury yields across the curve and investors' repricing of Fed rate cuts.

XRP risks extending losses as US-Iran war rages on

Ripple (XRP) has come under pressure, drifting lower to $1.35 at the time of writing on Tuesday. The over 2% correction looks poised to erase the previous day’s gains, which lifted the remittance token to $1.42.

Energy shock 2.0: Why rising Gas prices could hit the Euro

Even without a confirmed, sustained disruption, the mere risk to a key global energy chokepoint is enough to inject a significant premium into European Gas markets. And for the Euro, that matters.

Ripple falters amid sell-off jitters and negative funding rates

Ripple (XRP) has come under pressure, drifting lower to $1.35 at the time of writing on Tuesday. The over 2% correction looks poised to erase the previous day’s gains, which lifted the remittance token to $1.42.