- USD/JPY retreats from intraday high, reverses the previous day’s bounce off one-month low.
- 50-SMA pierces off 100-SMA from above to portray bearish signal.
- Downbeat RSI, failure to cross three-week-old horizontal resistance keep sellers hopeful.
- Multiple tops marked since early February, two-month-long ascending support line challenge Yen pair bears.
USD/JPY takes offers to renew intraday low around 134.00 during early Wednesday as the Yen pair sellers reverse the previous day’s corrective bounce off a one-month low. In doing so, the quote justifies the bearish signals from the moving average crossover, as well as the downbeat Relative Strength Index (RSI) line, placed at 14.
That said, the 50-SMA prods the 100-SMA from above and joins the downbeat RSI line to suggest the USD/JPY pair’s further declines.
However, a five-week-old horizontal support area near 133.90-85 appears a tough nut to crack for the Yen pair bears.
In a case where the USD/JPY slips beneath the 133.85 support, the odds of witnessing an extended south-run towards a two-month-old ascending support line, close to 130.55 by the press time, can’t be ruled out.
Meanwhile, an area comprising multiple tops marked since February 17, near 135.05-15, restricts immediate USD/JPY upside.
Even if the quote traces the bullish MACD signals and crosses the 135.15 resistance, a convergence of the 50-SMA and the 100-SMA, around 135.65-70 by the press time, will be crucial to watch as it holds the key for the USD/JPY run-up towards the monthly high of 137.91.
USD/JPY: Four-hour chart
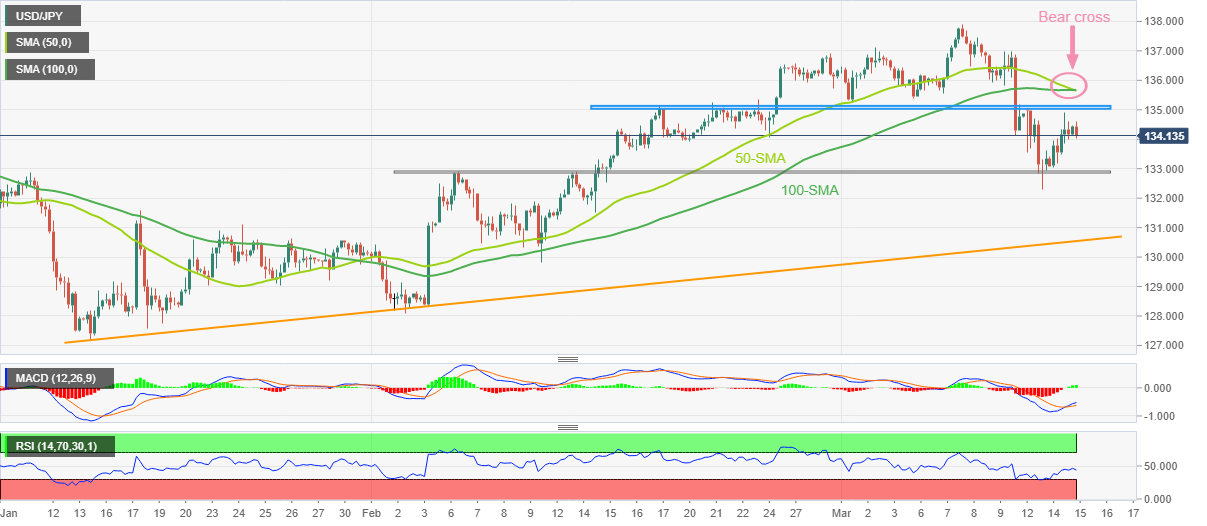
Trend: Further downside expected
Information on these pages contains forward-looking statements that involve risks and uncertainties. Markets and instruments profiled on this page are for informational purposes only and should not in any way come across as a recommendation to buy or sell in these assets. You should do your own thorough research before making any investment decisions. FXStreet does not in any way guarantee that this information is free from mistakes, errors, or material misstatements. It also does not guarantee that this information is of a timely nature. Investing in Open Markets involves a great deal of risk, including the loss of all or a portion of your investment, as well as emotional distress. All risks, losses and costs associated with investing, including total loss of principal, are your responsibility. The views and opinions expressed in this article are those of the authors and do not necessarily reflect the official policy or position of FXStreet nor its advertisers. The author will not be held responsible for information that is found at the end of links posted on this page.
If not otherwise explicitly mentioned in the body of the article, at the time of writing, the author has no position in any stock mentioned in this article and no business relationship with any company mentioned. The author has not received compensation for writing this article, other than from FXStreet.
FXStreet and the author do not provide personalized recommendations. The author makes no representations as to the accuracy, completeness, or suitability of this information. FXStreet and the author will not be liable for any errors, omissions or any losses, injuries or damages arising from this information and its display or use. Errors and omissions excepted.
The author and FXStreet are not registered investment advisors and nothing in this article is intended to be investment advice.
Recommended content
Editors’ Picks

AUD/USD struggles near multi-month low; looks to US CPI for fresh impetus
AUD/USD languishes near a multi-month low during the Asian session on Wednesday and seems vulnerable amid a bullish USD. Expectations that inflationary import tariffs from US President-elect Donald Trump will push up prices and limit the scope for the Fed to cut rates remain supportive of elevated US bond yields.

USD/JPY sits near its highest level since July, close to 155.00 as traders await US CPI
USD/JPY stands firm near its highest level since July 30 amid speculations that a fragile minority government in Japan will make it difficult for the BoJ to tighten its monetary policy further. Moreover, fears that US President-elect Donald Trump might again hit Japan with protectionist trade measures continue to undermine the JPY.

Gold price oscillates around $2,600, just above a nearly two-month low ahead of US inflation
Gold price consolidates its recent heavy losses to the lowest level since September 20 as bears opt to pause for a breather ahead of the crucial US CPI report, which will influence Fed rate-cut expectations and provide a fresh impetus.

Ripple could rally 50% following renewed investor interest
Ripple's XRP rallied nearly 20% on Tuesday, defying the correction seen in Bitcoin and Ethereum as investors seem to be flocking toward the remittance-based token. XRP could rally nearly 50% if it sustains a firm close above the neckline resistance of an inverted head and shoulders pattern.
Five fundamentals: Fallout from the US election, inflation, and a timely speech from Powell stand out Premium
What a week – the US election lived up to their hype, at least when it comes to market volatility. There is no time to rest, with politics, geopolitics, and economic data promising more volatility ahead.

Best Forex Brokers with Low Spreads
VERIFIED Low spreads are crucial for reducing trading costs. Explore top Forex brokers offering competitive spreads and high leverage. Compare options for EUR/USD, GBP/USD, USD/JPY, and Gold.