- USD/JPY remains subdued around the 144.40-80 area as traders brace for the weekend.
- The interest rates differential, and central bank monetary policy divergence, are tailwinds for the USD/JPY.
The USD/JPY consolidates in the 144.00-145.00 area following last week’s Bank of Japan (BoJ) intervention, which had kept the major directionless, as traders remain on the sidelines. Despite the solid correlation with the US 10-year T-bond yield, piercing the 4% threshold during the week, the USD/JPY did not attempt to clear the 145.00 figure. At the time of writing, the USD/JPY is trading at 144.70, above its opening price.
USD/JPY Price Analysis: Technical outlook
Given the backdrop that, fundamentally speaking, the interest rates differential between both economies, the central bank divergency with the Bank of Japan’s dovish stance is a tailwind for the USD/JPY.
From a technical analysis perspective, the USD/JPY is range-bound, though it remains upward biased, based on where the daily moving averages (DMAs) are located. During the week, the USD/JPY trading range has been the 143.50-144.90 area, so any breaks below would likely send the major towards the 140.00 figure. Conversely, a re-test of the 145.00 is possible, but with the BoJ vigilance around it, traders are not challenging the central bank.
The USD/JPY one-hour chart depicted a triple-top formation that extended to a multi-top, with the major remaining trendless. On the downside, the confluence of the 20, 50, and 100-EMA at around 144.47/53 are support levels, which, once cleared, will send the USD/JPY towards the S1 daily pivot at 144.02, shy of the 200-EMA. A breach of the latter will expose the S2 pivot at 143.50, followed by the S3 daily pivot point at 143.27.
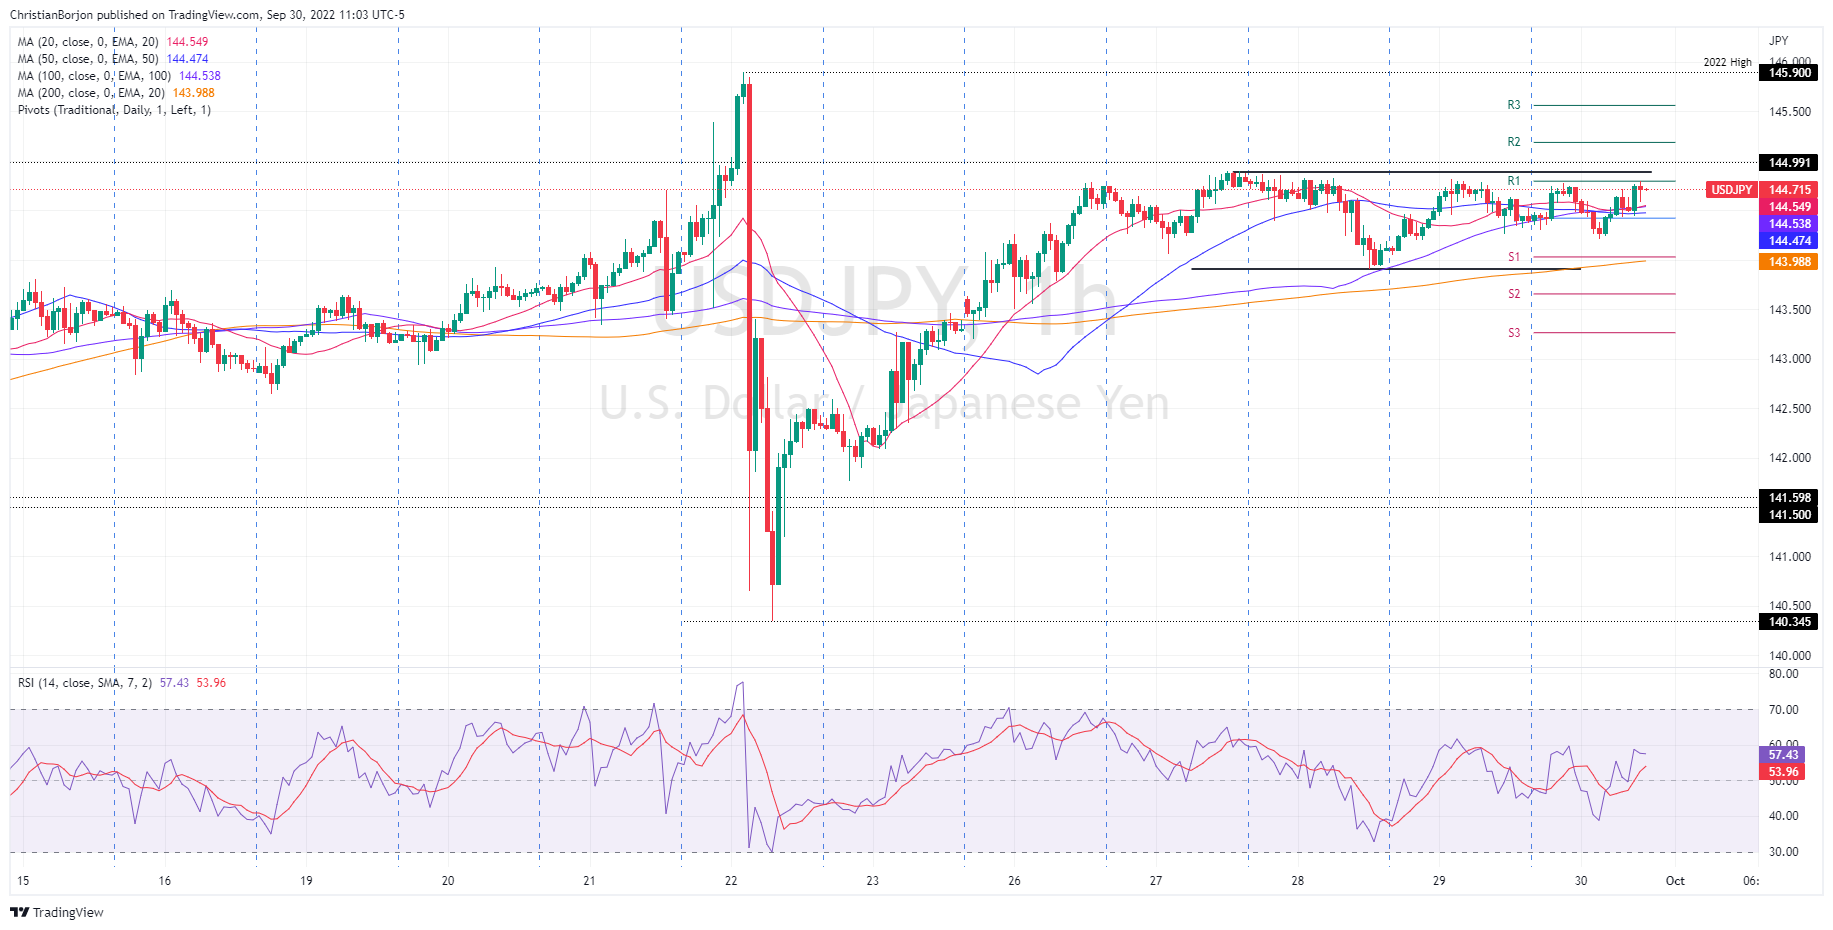
USD/JPY Key Technical Levels
Information on these pages contains forward-looking statements that involve risks and uncertainties. Markets and instruments profiled on this page are for informational purposes only and should not in any way come across as a recommendation to buy or sell in these assets. You should do your own thorough research before making any investment decisions. FXStreet does not in any way guarantee that this information is free from mistakes, errors, or material misstatements. It also does not guarantee that this information is of a timely nature. Investing in Open Markets involves a great deal of risk, including the loss of all or a portion of your investment, as well as emotional distress. All risks, losses and costs associated with investing, including total loss of principal, are your responsibility. The views and opinions expressed in this article are those of the authors and do not necessarily reflect the official policy or position of FXStreet nor its advertisers. The author will not be held responsible for information that is found at the end of links posted on this page.
If not otherwise explicitly mentioned in the body of the article, at the time of writing, the author has no position in any stock mentioned in this article and no business relationship with any company mentioned. The author has not received compensation for writing this article, other than from FXStreet.
FXStreet and the author do not provide personalized recommendations. The author makes no representations as to the accuracy, completeness, or suitability of this information. FXStreet and the author will not be liable for any errors, omissions or any losses, injuries or damages arising from this information and its display or use. Errors and omissions excepted.
The author and FXStreet are not registered investment advisors and nothing in this article is intended to be investment advice.


Recommended content
Editors’ Picks

AUD/USD holds above mid-0.6300s amid mixed fundamental cues
AUD/USD consolidates near the weekly low touched on Wednesday amid fading optimism over a quick resolution to the US-China trade dispute. Moreover, easing concerns about the Fed's independence assists the USD to preserve its recovery gains registered over the past two days and acts as a headwind for the currency pair.

USD/JPY snaps a two-day winning streak to over one-week high
USD/JPY eases from over a one-week top set on Wednesday and stalls this week's recovery move from a multi-month, though it lacks follow-through selling. Concerns about the US-China trade standoff and the divergent BoJ-Fed policy expectations continue to underpin the JPY, which weighs on the currency pair.

Gold price rallies back to $3,340 area on fading US-China trade deal optimism
Gold price regains positive traction during the Asian session on Thursday and snaps a two-day losing streak to the $3,260 area, or the weekly low touched the previous day. The optimism over a possible US-China trade deal fades quickly and revives demand for the safe-haven bullion.

TRUMP meme coin rallies following announcement of President Trump's upcoming dinner with top 220 holders
Official TRUMP rallied 50% on Wednesday after the team behind the meme coin announced plans for its top 220 token holders to have a dinner with President Donald Trump in May. The announcement also included an extension of the token's initial unlock plan by an additional 90 days.

Five fundamentals for the week: Traders confront the trade war, important surveys, key Fed speech Premium
Will the US strike a trade deal with Japan? That would be positive progress. However, recent developments are not that positive, and there's only one certainty: headlines will dominate markets. Fresh US economic data is also of interest.

The Best brokers to trade EUR/USD
SPONSORED Discover the top brokers for trading EUR/USD in 2025. Our list features brokers with competitive spreads, fast execution, and powerful platforms. Whether you're a beginner or an expert, find the right partner to navigate the dynamic Forex market.