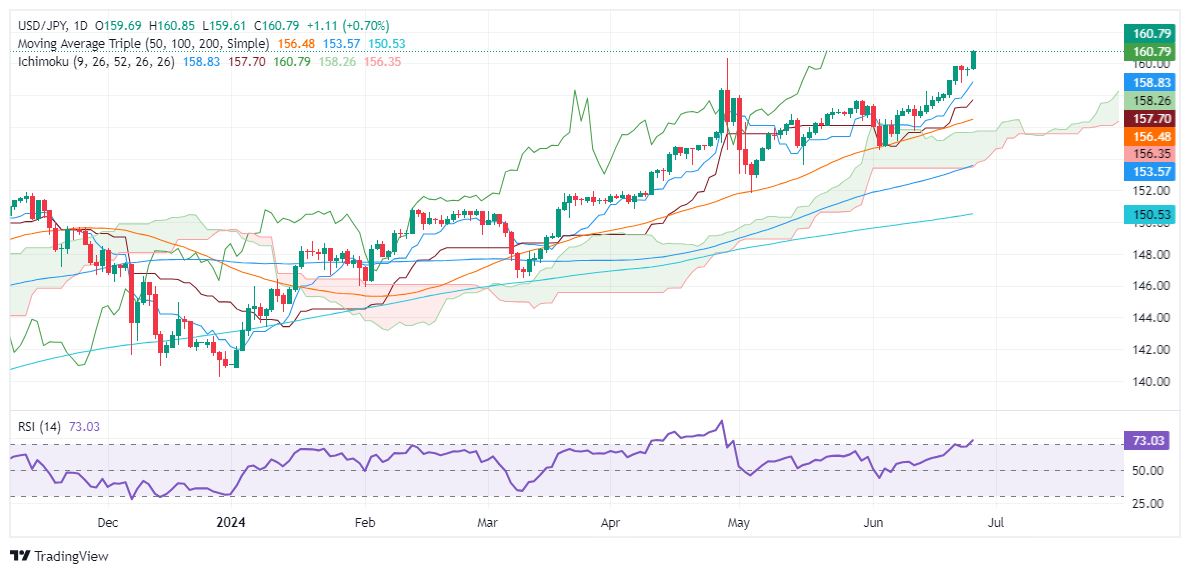
• USD/JPY reaches multi-year peak at 160.83, surpassing key 160.00 level amid USD strength.
  • Technicals show strong uptrend with overbought RSI, buying momentum strong.
  • Resistance levels: 161.00, 162.00, 164.87 (Nov 1986 high), 178 (Apr 1986 high).
  • Support found at 158.75 (June 24 low), Tenkan-Sen at 157.82, Senkou Span A at 157.53, Kijun-Sen at 157.24.

The USD/JPY rallied sharply during Wednesday’s session after the pair hit a 38-year high past the 160.00 psychological figure, seen as the line of the sand for Japanese authorities and the Japanese Yen to intervene in the FX space. Nevertheless, failure to do it prompted US dollar bulls to push the exchange rate higher, and at the time of writing, the pair traded at 160.83, which was up 0.73%.

USD/JPY Price Analysis: Technical outlook

The USD/JPY is upward biased and extended its gains past the psychological 160.00 barrier for the second time since April 29, when the pair printed a year-to-date (YTD) high of 160.32. This has reignited fears that Japanese authorities or the Bank of Japan (BoJ) could step into the plate to halt Yen’s depreciation.

Momentum favors buyers, with the Relative Strength Index (RSI) at overbought conditions. However, due to the strength of the uptrend, most technicians use 80 as “extreme” overextended conditions.

The next resistance would be the psychological levels of 161.00, 162.00, and so forth, ahead of testing November’s 1986 high of 164.87, followed by April's 1986 high of 178.

Conversely, if USD/JPY drops below 160.00, the first support would be June’s 24 low of 158.75, followed by the Tenkan-Sen at 157.82. Once those levels are cleared, the next stop would be the Senkou Span A at 157.53, and then the Kijun-Sen at 157.24.

USD/JPY Price Action – Daily Chart

USD/JPY

Overview
Today last price 160.8
Today Daily Change 1.12
Today Daily Change % 0.70
Today daily open 159.68
 
Trends
Daily SMA20 157.41
Daily SMA50 156.35
Daily SMA100 153.45
Daily SMA200 150.47
 
Levels
Previous Daily High 159.76
Previous Daily Low 159.19
Previous Weekly High 159.84
Previous Weekly Low 157.16
Previous Monthly High 157.99
Previous Monthly Low 151.86
Daily Fibonacci 38.2% 159.54
Daily Fibonacci 61.8% 159.41
Daily Pivot Point S1 159.32
Daily Pivot Point S2 158.97
Daily Pivot Point S3 158.76
Daily Pivot Point R1 159.89
Daily Pivot Point R2 160.11
Daily Pivot Point R3 160.46


Share: Feed news

Information on these pages contains forward-looking statements that involve risks and uncertainties. Markets and instruments profiled on this page are for informational purposes only and should not in any way come across as a recommendation to buy or sell in these assets. You should do your own thorough research before making any investment decisions. FXStreet does not in any way guarantee that this information is free from mistakes, errors, or material misstatements. It also does not guarantee that this information is of a timely nature. Investing in Open Markets involves a great deal of risk, including the loss of all or a portion of your investment, as well as emotional distress. All risks, losses and costs associated with investing, including total loss of principal, are your responsibility. The views and opinions expressed in this article are those of the authors and do not necessarily reflect the official policy or position of FXStreet nor its advertisers. The author will not be held responsible for information that is found at the end of links posted on this page.

If not otherwise explicitly mentioned in the body of the article, at the time of writing, the author has no position in any stock mentioned in this article and no business relationship with any company mentioned. The author has not received compensation for writing this article, other than from FXStreet.

FXStreet and the author do not provide personalized recommendations. The author makes no representations as to the accuracy, completeness, or suitability of this information. FXStreet and the author will not be liable for any errors, omissions or any losses, injuries or damages arising from this information and its display or use. Errors and omissions excepted.

The author and FXStreet are not registered investment advisors and nothing in this article is intended to be investment advice.

Recommended content


Recommended content

Editors’ Picks

EUR/USD retreats to 1.0700 area following post-PCE jump

EUR/USD retreats to 1.0700 area following post-PCE jump

After spiking to a daily high of 1.0720 with the immediate reaction to US PCE inflation data, EUR/USD lost its traction and declined to the 1.0700 area. Investors remain cautious ahead of this weekend's French election and make it difficult for the Euro to gather strength.

EUR/USD News

GBP/USD stays below 1.2650 after US inflation data

GBP/USD stays below 1.2650 after US inflation data

GBP/USD struggles to preserve its bullish momentum and trades below 1.2650 in the American session on Friday. Earlier in the day, the data from the US showed that the annual core PCE inflation declined to 2.6% in May, limiting the USD's upside and helping the pair hold its ground.

GBP/USD News

Gold keeps its daily gains near $2,330 following US PCE data

Gold keeps its daily gains near $2,330 following US PCE data

Gold prices maintain their constructive bias around $2,330 after US inflation readings gauged by the PCE matched consensus in May and US yields advance slightly across the curve.

Gold News

BTC struggles around the $62,000 level

BTC struggles around the $62,000 level

Bitcoin price faces pullback resistance at the lower band of the descending wedge around $62,000. Ethereum price finds support at $3,288, the 61.8% Fibonacci retracement level. Ripple price faces resistance at $0.500, its daily resistance level.

Read more

French Elections Preview: Euro to suffer after the calm, as specter of extremists, uncertainty rise Premium

French Elections Preview: Euro to suffer after the calm, as specter of extremists, uncertainty rise

The first round of French parliamentary elections is set to trigger high uncertainty. Soothing messages from the far right and far left leave the Euro vulnerable to falls. Calm may return only after the second round of voting on  July 7.

Read more

Forex MAJORS

Cryptocurrencies

Signatures