|

USD/JPY Price Analysis: Hanging Man at highs could be bearish omen

  • USD/JPY forms a bearish candlestick pattern at the multi-year highs. 
  • A bearish close on Friday would enhance the possibilities of a pullback. 
  • The BoJ has historically intervened to strengthen JPY in the 151.000s, indicating more downside pressure likely. 

USD/JPY has formed a bearish Hanging Man Japanese candlestick pattern (circled) at key chart highs in the 151.000s on Friday, suggesting a heightened risk of a short-term reversal and pullback. 

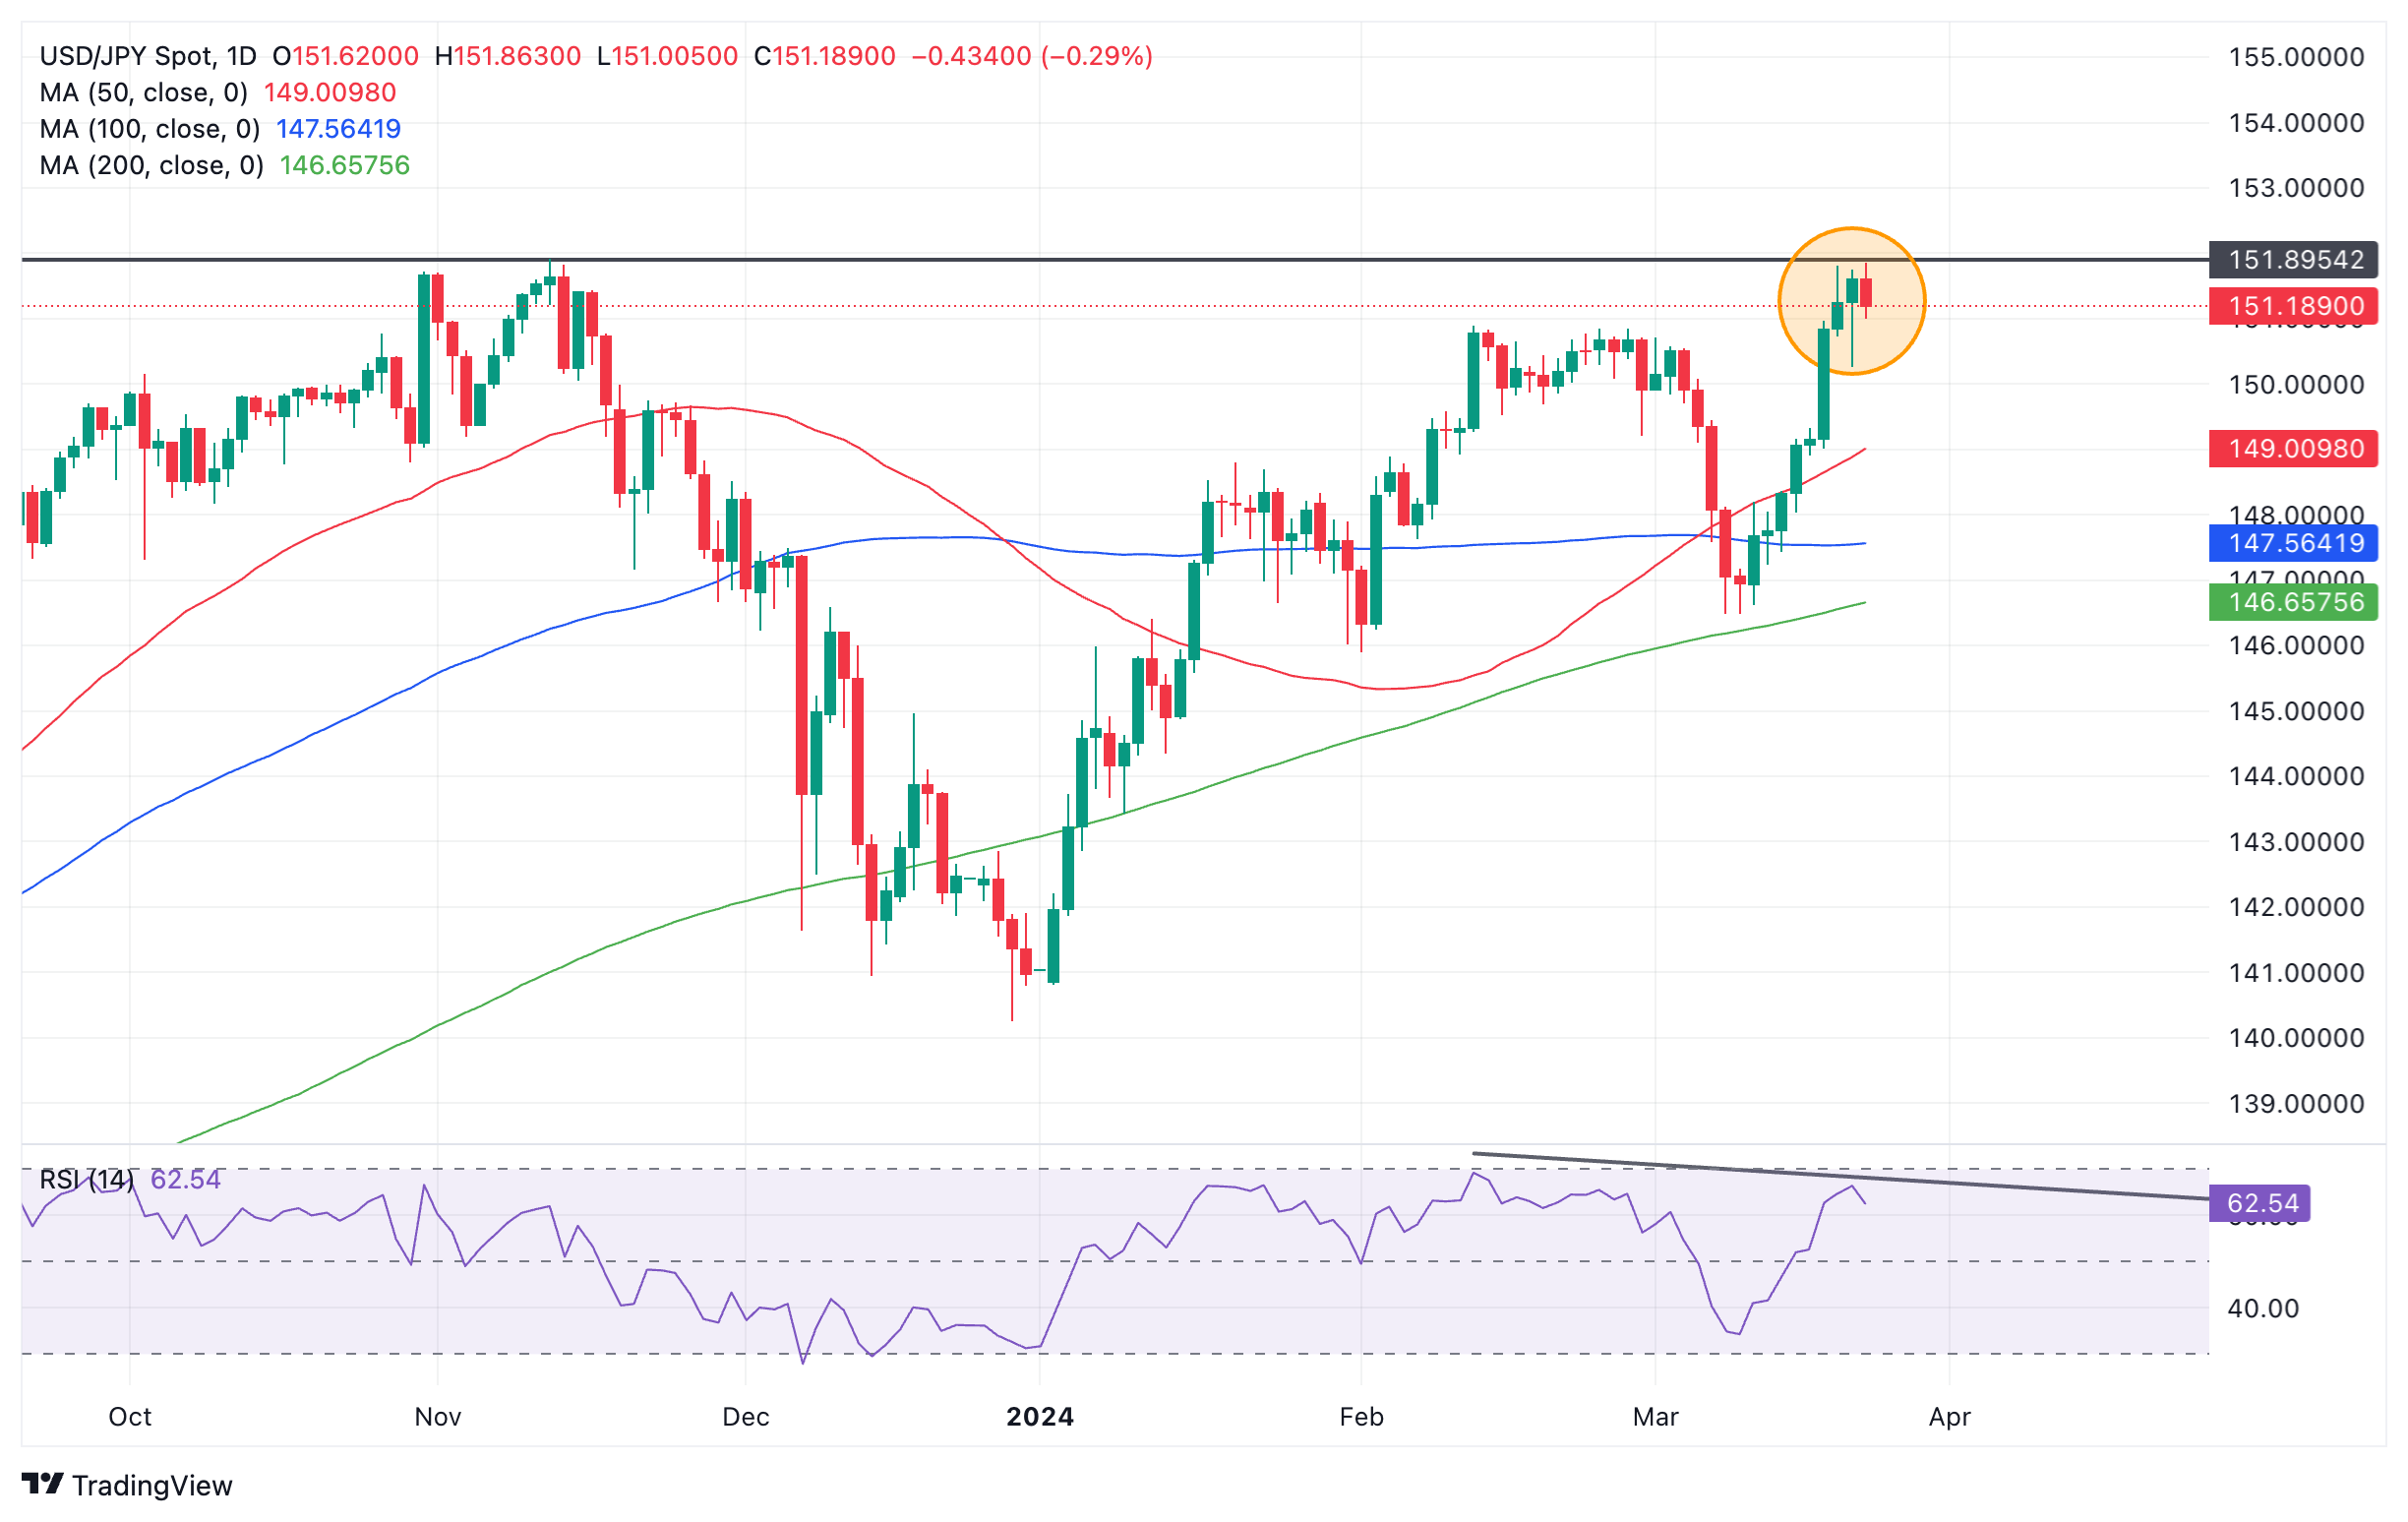
US Dollar versus Japanese Yen: Daily chart

The combination of the fact that the pair has tested the level of the 2023 high and formed the bearish pattern increases the possibility of a decline following on. 

If Friday ends as a bearish red candlestick this will add confirmation to the Hanging Man formed on Thursday, and further increase the odds of more downside. 

Japanese candlesticks are only short-term reversal patterns, however, so the move lower may be short-lived. 

The fact that the 151.000s represents a zone in which the Bank of Japan (BoJ) has been known to intervene to strengthen the Yen in the past, further increases the chances of imminent weakness for the pair. 

A pullback might be expected to go as low as support at the 50-day Simple Moving Average (SMA) situated at 149.009. 

Alternatively, a recovery and clear break above 152.000 would suggest bulls continue to have the upper hand and the BoJ is reluctant or unable to intervene sufficiently to move the exchange rate.  

Such a move, however, would be unlikely to rise much higher given the forces pitched against it, with a possible target at the next whole number of 153.000.

Author

Joaquin Monfort

Joaquin Monfort is a financial writer and analyst with over 10 years experience writing about financial markets and alt data. He holds a degree in Anthropology from London University and a Diploma in Technical analysis.

More from Joaquin Monfort
Share:

Editor's Picks

EUR/USD meets initial support around 1.1800

EUR/USD remains on the back foot, although it has managed to reverse the initial strong pullback toward the 1.1800 region and regain some balance, hovering around the 1.1850 zone as the NA session draws to a close on Tuesday. Moving forward, market participants will now shift their attention to the release of the FOMC Minutes and US hard data on Wednesday.
 

GBP/USD bounces off lows, retargets 1.3550

After bottoming out just below the 1.3500 yardstick, GBP/USD now gathers some fresh bids and advances to the 1.3530-1.3540 band in the latter part of Tuesday’s session. Cable’s recovery comes as the Greenback surrenders part of its advance, although it keeps the bullish bias well in place for the day.

Gold remains offered below $5,000

Gold stays on the defensive on Tuesday, receding to the sub-$5,000 region per troy ounce on the back of the persistent move higher in the Greenback. The precious metal’s decline is also underpinned by the modest uptick in US Treasury yields across the spectrum.

Ethereum Price Forecast: BitMine extends ETH buying streak, says long-term outlook remains positive

Ethereum (ETH) treasury firm BitMine Immersion continued its weekly purchase of the top altcoin last week after acquiring 45,759 ETH.

UK jobs market weakens, bolstering rate cut hopes

In the UK, the latest jobs report made for difficult reading. Nonetheless, this represents yet another reminder for the Bank of England that they need to act swiftly given the collapse in inflation expected over the coming months. 

Ripple slides to $1.45 as downside risks surge

Ripple edges lower at the time of writing on Tuesday, from the daily open of $1.48, as headwinds persist across the crypto market. A short-term support is emerging at $1.45, but a buildup of bearish positions could further weaken the derivatives market and prolong the correction.

USD/JPY Price Analysis: Hanging Man at highs could be bearish omen