|

USD/JPY Price Analysis: Greenback trades at three-day lows vs. yen, nearing 109.00 handle

  • USD/JPY is breaking to the downside below the 109.28 level.
  • The level to beat for bears is the 109.05 support. 
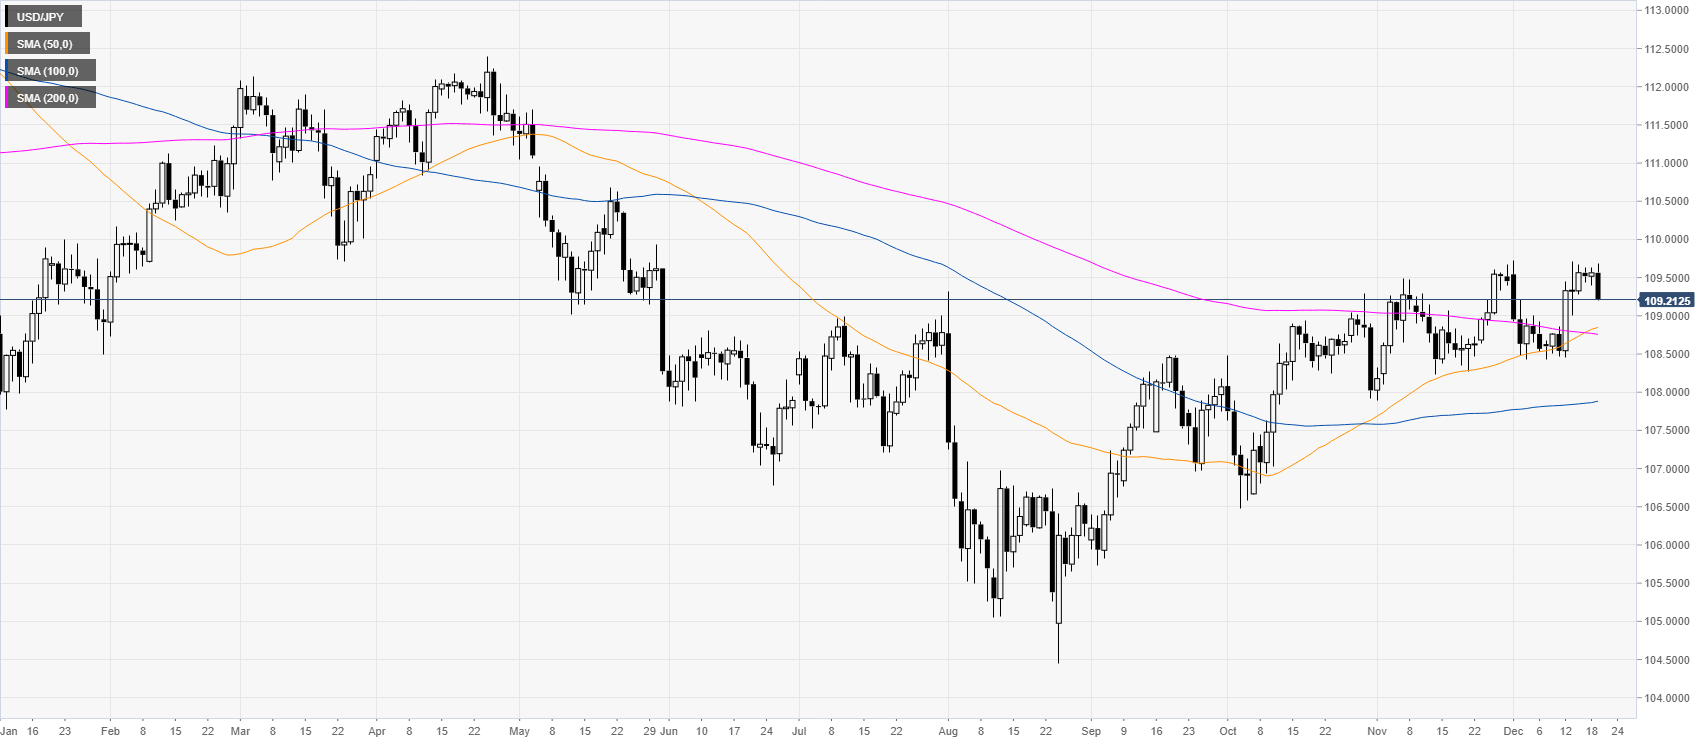
 

USD/JPY daily chart

 
USD/JPY is trading off the December highs below the 109.50 level, which was a strong support/ resistance level throughout the year. 
 

USD/JPY four-hour chart

 
The bulls are losing their grip as the market is trading at its lowest in three-day and breaks below the 109.28 level. The spot is challenging the 50 SMA on the four-hour chart as bears are probably setting their eyes on 109.05 and 108.60 price levels, according to the Technical Confluences Indicator. A recovery could find resistance at the 108.28 level, followed by 109.44 and 109.68.  


Additional key levels

USD/JPY

Overview
Today last price109.21
Today Daily Change-0.35
Today Daily Change %-0.32
Today daily open109.56
 
Trends
Daily SMA20109.04
Daily SMA50108.82
Daily SMA100107.86
Daily SMA200108.77
 
Levels
Previous Daily High109.63
Previous Daily Low109.4
Previous Weekly High109.71
Previous Weekly Low108.43
Previous Monthly High109.67
Previous Monthly Low107.89
Daily Fibonacci 38.2%109.54
Daily Fibonacci 61.8%109.49
Daily Pivot Point S1109.43
Daily Pivot Point S2109.3
Daily Pivot Point S3109.2
Daily Pivot Point R1109.66
Daily Pivot Point R2109.76
Daily Pivot Point R3109.89

Author

Flavio Tosti

Flavio Tosti

Independent Analyst


More from Flavio Tosti
Share:

Markets move fast. We move first.

Orange Juice Newsletter brings you expert driven insights - not headlines. Every day on your inbox.

By subscribing you agree to our Terms and conditions.

Editor's Picks

EUR/USD falls toward 1.1700 on broad USD recovery

EUR/USD turns south and declines toward 1.1700 on Wednesday. The US Dollar gathers recovery momentum and forces the pair to stay on the back foor, as traders look to USD short-covering ahead of US inflation report on Thursday. However, the downside could be capped by hawkish ECB expectations. 

GBP/USD trades deep in red below 1.3350 after soft UK inflation data

GBP/USD stays under strong selling pressure midweek and trades below 1.3350. The UK annual headline and core CPI rose by 3.2% each, missing estimates of 3.5% and 3.4%, respectively, reaffirming dovish BoE expectations and smashing the Pound Sterling across the board ahead of Thurday's BoE policy announcements. 

Gold clings to moderate daily gains above $4,300

Following Tuesday's volatile action, Gold regains its traction on Wednesday and trades in positive territory above $4,300. While the buildup in the USD recovery momentum caps XAU/USD's upside, the cautious market stance helps the pair hold its ground.

Bitcoin risks deeper correction as ETF outflows mount, derivative traders stay on the sidelines

Bitcoin (BTC) remains under pressure, trading below $87,000 on Wednesday, nearing a key support level. A decisive daily close below this zone could open the door to a deeper correction.

Monetary policy: Three central banks, three decisions, the same caution

While the Fed eased its monetary policy on 10 December for the third consecutive FOMC meeting, without making any guarantees about future action, the BoE, the ECB and the BoJ are holding their respective meetings this week. 

AAVE slips below $186 as bearish signals outweigh the SEC investigation closure

Aave (AAVE) price continues its decline, trading below $186 at the time of writing on Wednesday after a rejection at the key resistance zone. Derivatives positioning and momentum indicators suggest that bearish forces still dominate in the near term.