- USD/JPY gains momentum and edges higher to the 143.65 mark.
- The pair stands above the 50- and 100-hour EMAs with an upward slope.
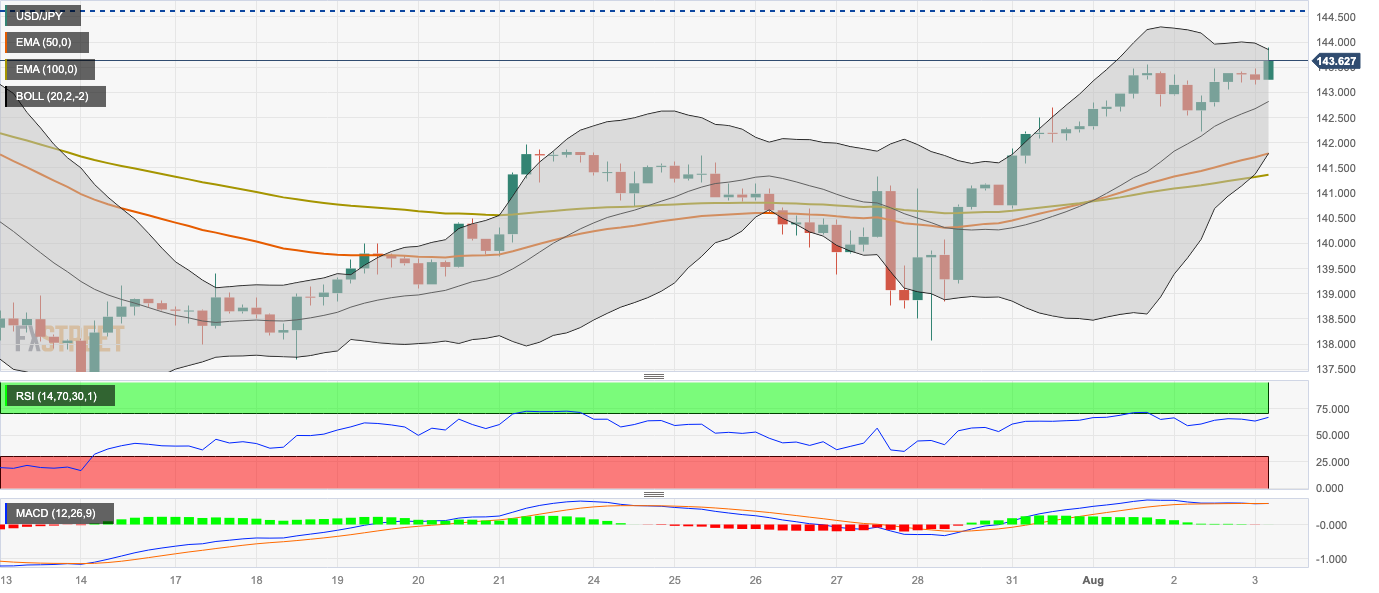
- The initial resistance level to watch is 143.80; the first support stop is located at 142.80.
The USD/JPY pair extends its upside heading into the early European session on Thursday. Bank of Japan (BoJ) Governor Kazuo Ueda indicated that the tolerance band for the benchmark 10-year Japanese Government Bonds (JGB) will widen from 0.5% to 1.0%. The move pushed JGB yields to their highest level since 2014. The 10-year JGB rose to 0.65% on Thursday. The major pair currently trades around 143.65, up to 0.24% for the day.
According to the four-hour chart, the USD/JPY pair stands above the 50- and 100-hour Exponential Moving Averages (EMAs) with an upward slope, which means the path of least resistance is to the upside for the time being.
Any meaningful follow-through buying beyond 143.80 (the upper boundary of the Bollinger Band) could pave the way to the next hurdle at 144.65 (High of July 6). Further north, the 145.00 area appears to be a tough nut to crack for USD/JPY. The mentioned level is a confluence of a psychological round mark and a year-to-date high (YTD).
On the other hand, the first support stop for USD/JPY is located at 142.80 (midline of the Bollinger Band). The additional downside filter to watch is 141.78, highlighting the 50-hour EMA and the lower limit of the Bollinger Band. A decisive break below the latter would see a drop to 141.35 (100-hour EMA) and 141.00 (a psychological round figure).
It’s worth noting that the Relative Strength Index (RSI) stands above 50, and the MACD holds in bullish territory, which indicates that the upside momentum has been activated.
USD/JPY four-hour chart
Information on these pages contains forward-looking statements that involve risks and uncertainties. Markets and instruments profiled on this page are for informational purposes only and should not in any way come across as a recommendation to buy or sell in these assets. You should do your own thorough research before making any investment decisions. FXStreet does not in any way guarantee that this information is free from mistakes, errors, or material misstatements. It also does not guarantee that this information is of a timely nature. Investing in Open Markets involves a great deal of risk, including the loss of all or a portion of your investment, as well as emotional distress. All risks, losses and costs associated with investing, including total loss of principal, are your responsibility. The views and opinions expressed in this article are those of the authors and do not necessarily reflect the official policy or position of FXStreet nor its advertisers. The author will not be held responsible for information that is found at the end of links posted on this page.
If not otherwise explicitly mentioned in the body of the article, at the time of writing, the author has no position in any stock mentioned in this article and no business relationship with any company mentioned. The author has not received compensation for writing this article, other than from FXStreet.
FXStreet and the author do not provide personalized recommendations. The author makes no representations as to the accuracy, completeness, or suitability of this information. FXStreet and the author will not be liable for any errors, omissions or any losses, injuries or damages arising from this information and its display or use. Errors and omissions excepted.
The author and FXStreet are not registered investment advisors and nothing in this article is intended to be investment advice.
Recommended content
Editors’ Picks

Gold price conquers $3,100 for the first time ever on tariff war fears
The record rally in Gold price remains unabated as buyers conquer the $3,100 threshold for the time on record. Heightening fears of a potential global trade war and stagflation in the United States intensify safe-haven demand for the traditional store of value, Gold.

USD/JPY extends the slide below 149.00 as trade war fears ramp up risk aversion
USD/JPY extends losses below 149.00 in Monday's Asian trading. Hawkish BoJ expectations and heightening risk-off mood amid escalating tensions underpin the safe-haven Japnese Yen. Moreover, fears of stagflation in the US keep the US Dollar undermined, adding to the pair's downslide.

AUD/USD turns lower below 0.6300 as risk-off flows intensify
AUD/USD has ereased earlier gains to edge lower below 0.6300 in the Asian session on Monday. Trump's tariff concerns outweigh mixed Chinese NBS March PMI data, Australia's hot private inflation data and broad US Dollar weakness, exerting downward pressure on the pair as risk-aversion intensifies.

Bitcoin, Ethereum and Ripple decline as President Trump’s team considers “broader and higher tariffs”
Bitcoin continues its decline, trading below $82,000 on Monday after falling 4.29% the previous week. Ethereum and Ripple followed BTC’s footsteps and declined by 9.88% and 12.40%, respectively.

US: Trump's 'Liberation day' – What to expect?
Trump has so far enacted tariff changes that have lifted the trade-weighted average tariff rate on all US imports by around 5.5-6.0%-points. While re-rerouting of trade will decrease the effectiveness of tariffs over time, the current level is already close to the highest since the second world war.

The Best brokers to trade EUR/USD
SPONSORED Discover the top brokers for trading EUR/USD in 2025. Our list features brokers with competitive spreads, fast execution, and powerful platforms. Whether you're a beginner or an expert, find the right partner to navigate the dynamic Forex market.