|

USD/JPY Price Analysis: Firm at around 144.40, as bull's eye 145.00 and beyond

  • USD/JPY extends gains for six consecutive days, hitting a new YTD high but stabilizing ahead of the Tokyo Open.
  • Despite overbought signals from the RSI, the strong uptrend justifies readings above 70, with a potential reversal at 80.
  • USD/JPY’s breach past 145.00 may lead to resistance at 145.10 and 146.00, while a reversal could find support at 144.00 and 143.73.

The USD/JPY extends its gains to six straight days, but as Thursday’s Asian session begins, it retraces some 0.08% ahead of the Tokyo open. On its way north, the USD/JPY reached a new year-to-date (YTD) high of 144.61 but stabilized and finished around 144.40. At the time of writing, the USD/JPY exchanges hands at around the 144.30 area.

USD/JPY Price Analysis: Technical outlook

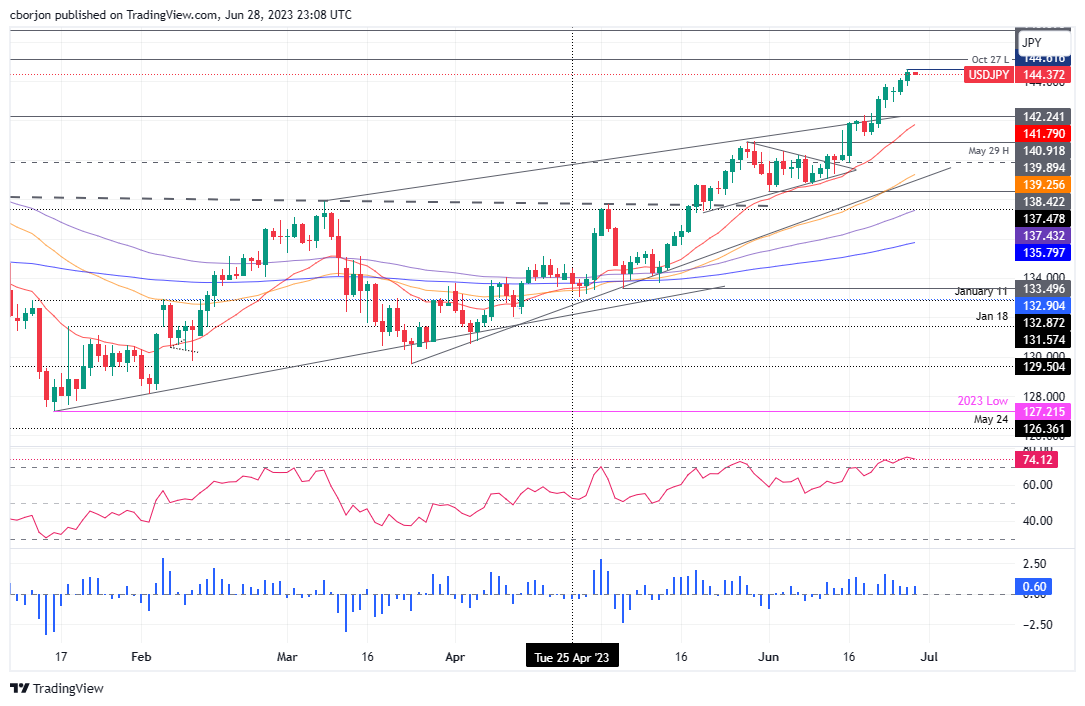
The USD/JPY remains upward biased but subject to verbal intervention by Japanese authorities. Even though the Relative Strength Index (RSI) suggests that prices are overbought, it remains shy of reaching extreme readings close to 80. In this case, the USD/JPY strong uptrend justifies RSI above 70, and once it comes the 80 level, the chances for a possible reversal increase.

Oscillators like the Relative Strength Index (RSI) is overbought but shy of getting to 80, while the three-day Rate of Change (RoC) suggests buying pressure is fading.

If USD/JPY climbs past 145.00, the next resistance will be the October 27 daily low at 145.10. Breach of the latter will expose the 146.00 figure, followed by the November 10 daily high at 146.59.

Conversely, if USD/JPY prints a reversal, the next support would be the 144.00 figure. Break below will expose the June 28 daily low of 143.73, followed by the November 22 daily high of 142.24.

USD/JPY Price Action – Daily chart

USD/JPY Daily chart

USD/JPY

Overview
Today last price144.41
Today Daily Change0.33
Today Daily Change %0.23
Today daily open144.08
 
Trends
Daily SMA20140.88
Daily SMA50138.19
Daily SMA100135.88
Daily SMA200137.22
 
Levels
Previous Daily High144.18
Previous Daily Low143.28
Previous Weekly High143.87
Previous Weekly Low141.21
Previous Monthly High140.93
Previous Monthly Low133.5
Daily Fibonacci 38.2%143.83
Daily Fibonacci 61.8%143.62
Daily Pivot Point S1143.51
Daily Pivot Point S2142.95
Daily Pivot Point S3142.62
Daily Pivot Point R1144.41
Daily Pivot Point R2144.74
Daily Pivot Point R3145.3

Author

Christian Borjon Valencia

Markets analyst, news editor, and trading instructor with over 14 years of experience across FX, commodities, US equity indices, and global macro markets.

More from Christian Borjon Valencia
Share:

Editor's Picks

EUR/USD weakens below 1.1700 as Middle East tensions drive US Dollar strength

The EUR/USD pair trades with mild losses around 1.1685, the lowest since late January, during the early Asian session on Tuesday. The US Dollar gathers strength against the Euro as escalating tensions in the Middle East boost safe-haven currencies. The preliminary reading of the Harmonized Index of Consumer Prices from the Eurozone will be published later on Tuesday.  

GBP/USD hits new yearly lows near 1.3300

GBP/USD adds to the recent bearish tone, approaching to the key 1.3300 support to reach fresh YTD troughs against the backdrop of the robust performance of the US Dollar. Indeed, Cable’s decline comes amid the firm demand for the safe-haven space in the wake of the US and Israel attacks to Iran.

Gold defends bids as US-Iran war continues to fuel safe-haven flows

Gold retains positive bias for the fifth consecutive day on Tuesday as rising geopolitical tensions in the Middle East continue to underpin safe-haven assets. However, a bullish US Dollar keeps the bullion below its highest level since late January, set on Monday, warranting caution before positioning for any further appreciation.

Strategy lifts holdings to 3.4% of Bitcoin's total supply amid inflows into crypto products

Strategy continued its accumulation of the top crypto last week, acquiring 3,015 BTC for $204 million amid renewed interest in crypto products after four weeks of outflows.

The market is not panicking it is repricing the probability distribution of Oil and time

At the end of the day, markets do not trade morality or geopolitics. They trade transmission channels. And the only channel that truly matters in this maelstrom runs through the price of energy and the time value of money.

Grass 20% bullish breakout defies broader market weakness

Grass (GRASS) is edging up above $0.30 at the time of writing on Monday. The token’s notable 20% intraday surge stands out amid heightened volatility in the broader crypto market.