|

USD/JPY Price Analysis: Fades bounce off key support zone surrounding 142.00 as US NFP looms

  • USD/JPY extends the previous day’s pullback from one-month high as bears attack multi-day-old horizontal support.
  • Bearish MACD signals, sustained trading below short-term key resistance line keeps Yen pair sellers hopeful.
  • 200-SMA, 140.00 act as additional downside filters before three-week-long support line prod bears.
  • US employment numbers need strong numbers to defy latest pullback moves.

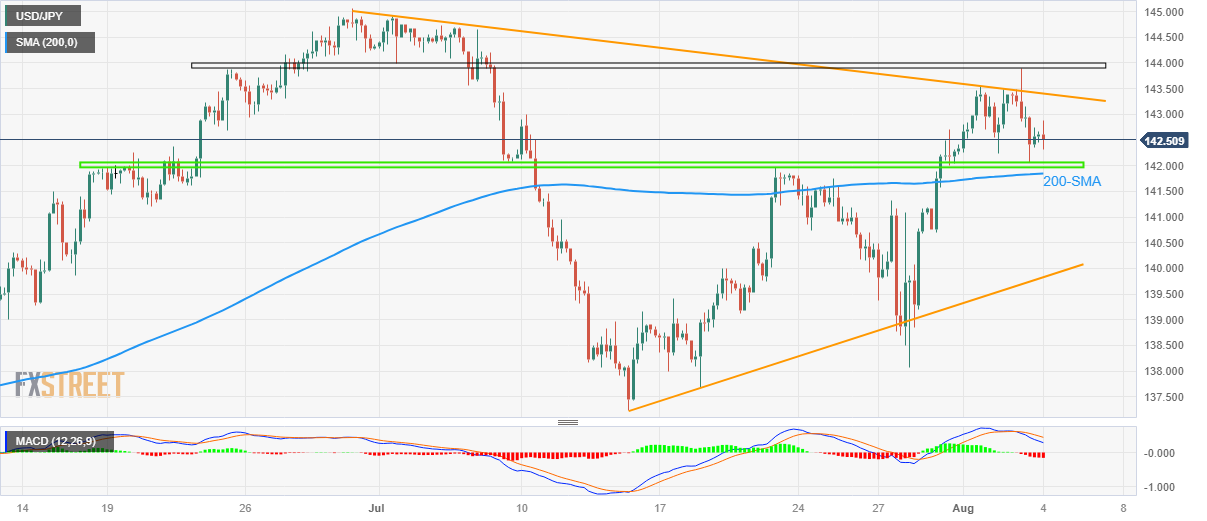
USD/JPY holds lower grounds near 142.50, clings to mild losses amid early Friday morning in Europe after reversing from the highest level in a month the previous day.

The Yen pair’s latest pullback could be linked to the market’s positioning for the US employment report for June, as well as a retreat of the US Treasury bond yields from a multi-day high marked the previous day.

Furthermore, bearish MACD signals and the Yen pair’s clear observance of the descending resistance line from June 30, at 143.40 by the press time, also keep the USD/JPY bears hopeful.

However, a horizontal area comprising multiple levels marked since June 18, around 142.00, quickly followed by the 200-SMA level of 141.85, restricts the Yen pair’s further downside.

In a case where the USD/JPY pair remains bearish past 141.85, a quick fall toward the 140.00 round figure can be expected while an ascending support line from July 14, close to 139.80, might challenge the sellers afterward.

Meanwhile, USD/JPY recovery remains elusive below the five-week-old descending resistance line of near 143.40.

Following that, a 1.5-month-long horizontal resistance area of around 143.90–144.00 will act as the final defense of the USD/JPY bears before challenging the yearly top marked in June around 145.00.

USD/JPY: Four-hour chart

Trend: Further downside expected

Additional important levels

Overview
Today last price142.48
Today Daily Change-0.11
Today Daily Change %-0.08%
Today daily open142.59
 
Trends
Daily SMA20140.65
Daily SMA50141.26
Daily SMA100137.78
Daily SMA200136.61
 
Levels
Previous Daily High143.89
Previous Daily Low142.06
Previous Weekly High141.82
Previous Weekly Low138.07
Previous Monthly High144.91
Previous Monthly Low137.24
Daily Fibonacci 38.2%142.76
Daily Fibonacci 61.8%143.19
Daily Pivot Point S1141.81
Daily Pivot Point S2141.02
Daily Pivot Point S3139.98
Daily Pivot Point R1143.64
Daily Pivot Point R2144.68
Daily Pivot Point R3145.46

Author

Anil Panchal

Anil Panchal

FXStreet

Anil Panchal has nearly 15 years of experience in tracking financial markets. With a keen interest in macroeconomics, Anil aptly tracks global news/updates and stays well-informed about the global financial moves and their implications.

More from Anil Panchal
Share:

Editor's Picks

EUR/USD retreats toward 1.1600 after upbeat US data

EUR/USD pulls away from session highs and declines toward 1.1600 in the American session on Wednesday. Upbeat private sector employment and ISM Services PMI data from the US help the US Dollar (USD) stay resilient against its rivals, limiting the pair's upside.

GBP/USD meets resistance around 1.3400

In line with its risk-linked peers, GBP/USD stages a modest comeback on Wednesday, although meeting some resistance around the 1.3400 neighbourhood. Cable’s humble recovery struggles to gather momentum as the Greenback benefits from better-than-forecast macroeconomic data releases.

Gold loses traction after testing $5,200

Gold corrects lower after testing $5,200 but manages to stay in positive territory in the second hald of the day on Wednesday. The precious metal remains well supported by the deterioration of the geopolitical scenario in the Middle East, while the US Dollar's resilience caps the upside.

Crypto Today: Bitcoin, Ethereum, XRP rebound amid mixed ETF flows

The cryptocurrency market is showing subtle recovery signs despite heightened global uncertainty following the United States (US) and Israel attacks on Iran and the subsequent retaliations that have morphed into a wider Middle East war.

First Venezuela, now Iran: The US-China energy war escalates

At first glance, the latest escalation involving the United States with both Iran and Venezuela looks like another chapter in a long-running geopolitical story. But viewed through a broader strategic lens, something else may be unfolding: Energy.

Solana Price Forecast: SOL consolidation near resistance as ETF inflows offer mild support

Solana price is facing slight rejection as it approaches the upper boundary of the consolidation range at around $88 on Wednesday. Institutional demand is strengthening as spot Exchange Traded Funds recorded two consecutive inflows so far this week.