|

USD/JPY Price Analysis: Declines towards 140.00 ahead of US core PCE Inflation data

  • USD/JPY continues to decline further towards 140.00 amid soft US Dollar.
  • Investors await the US core PCE price index data for further guidance.
  • USD/JPY may find an intermediate cushion near upward-sloping trendline.

The USD/JPY pair consolidates in a tight range near 142.00 after a sharp correction ahead of the United States core Personal Consumption Expenditure (PCE) price index data for November, which will be published at 13:30 GMT.

The core PCE inflation report is expected to remain soft as the Federal Reserve (Fed) has been keeping interest rates unchanged in the range of 5.25-5.50%. The downside in the major would continue if the underlying inflation turns out softer-than-anticipated. Meanwhile, deepening rate cut expectations from the Federal Reserve (Fed) have weighed heavily on the US Dollar Index (DXY). The USD Index has refreshed its four-month low around 101.55.

On the Tokyo front, Japan’s National Consumer Price Index (CPI) has remained above the 2% target for the 20th time in a row.  The Bank of Japan (BoJ) is expected to continue its ultra-dovish policy stance till wage growth in the Japanese economy gets high enough to keep inflation comfortably above 2%.

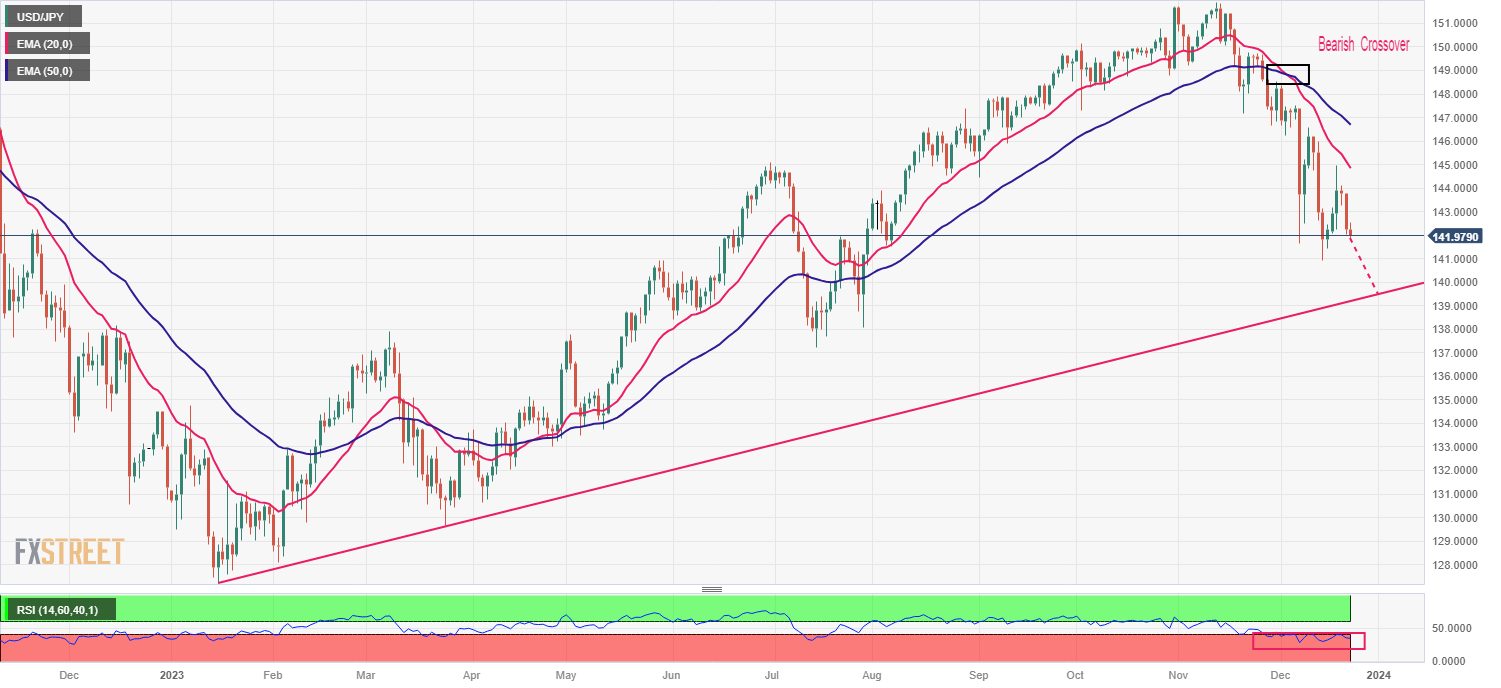
USD/JPY is consistently declining from more than one month. The downside momentum accelerated after a bearish crossover from the 20 and 50-day Exponential Moving Averages (EMA), which happened around 148.80. The asset is expected to decline further towards the upward-sloping trendline plotted from January 16 low at 127.22.

The Relative Strength Index (RSI) (14) is oscillating in the bearish range of 20.00-40.000, pointing to continuation of a downside momentum.

Fresh downside would appear if the asset drops below December 14 low near 141.00. This would drag it towards the upward-sloping trendline near 139.40, followed by July 28 low near 138.00.

In an alternate scenario, a recovery move above December 19 high near 145.00 would drive the asset towards December 11 high around 146.60, followed by December 6 high near 148.00.

USD/JPY daily chart

USD/JPY

Overview
Today last price141.99
Today Daily Change-0.24
Today Daily Change %-0.17
Today daily open142.23
 
Trends
Daily SMA20145.5
Daily SMA50148.28
Daily SMA100147.65
Daily SMA200142.72
 
Levels
Previous Daily High143.77
Previous Daily Low142.05
Previous Weekly High146.59
Previous Weekly Low140.94
Previous Monthly High151.91
Previous Monthly Low146.67
Daily Fibonacci 38.2%142.7
Daily Fibonacci 61.8%143.11
Daily Pivot Point S1141.6
Daily Pivot Point S2140.96
Daily Pivot Point S3139.88
Daily Pivot Point R1143.31
Daily Pivot Point R2144.4
Daily Pivot Point R3145.03

Author

Sagar Dua

Sagar Dua

FXStreet

Sagar Dua is associated with the financial markets from his college days. Along with pursuing post-graduation in Commerce in 2014, he started his markets training with chart analysis.

More from Sagar Dua
Share:

Markets move fast. We move first.

Orange Juice Newsletter brings you expert driven insights - not headlines. Every day on your inbox.

By subscribing you agree to our Terms and conditions.

Editor's Picks

EUR/USD clings to small gains near 1.1750

Following a short-lasting correction in the early European session, EUR/USD regains its traction and clings to moderate gains at around 1.1750 on Monday. Nevertheless, the pair's volatility remains low, with investors awaiting this weeks key US data releases and the ECB policy announcements.

GBP/USD edges higher toward 1.3400 as traders await key data and BoE

GBP/USD reverses its direction and advances toward 1.3400 following a drop to the 1.3350 area earlier in the day. The US Dollar struggles to gather recovery momentum as markets await Tuesday's Nonfarm Payrolls data, while the Pound Sterling holds steady ahead of the BoE policy announcements later in the week.

Gold builds on previous week's gains, approaches $4,350

Gold preserves its bullish momentum after rising more than 2% last week and climbs toward $4,350 on Monday. The precious metal extends its upside as the US Dollar remains on the back foot on growing expectations for a dovish Fed policy outlook next year.

Solana consolidates as spot ETF inflows near $1 billion signal institutional dip-buying

Solana price hovers above $131 at the time of writing on Monday, nearing the upper boundary of a falling wedge pattern, awaiting a decisive breakout. On the institutional side, demand for spot Solana Exchange-Traded Funds remained firm, pushing total assets under management to nearly $1 billion since launch. 

Big week ends with big doubts

The S&P 500 continued to push higher yesterday as the US 2-year yield wavered around the 3.50% mark following a Federal Reserve (Fed) rate cut earlier this week that was ultimately perceived as not that hawkish after all. The cut is especially boosting the non-tech pockets of the market.

Solana Price Forecast: SOL consolidates as spot ETF inflows near $1 billion signal institutional dip-buying

Solana (SOL) price hovers above $131 at the time of writing on Monday, nearing the upper boundary of a falling wedge pattern, awaiting a decisive breakout.