USD/JPY Price Analysis: Consolidation into US CPI, bulls on the prowl
- USD/JPY is in a sideways consolidation between hourly resistance and support
- There is red news on the calendar on Thursday so it will not be surprising to see the forex space tread water until the event.
- A break of resistance would be expected to see the price volt through price imbalances to the upside.

USD/JPY is biased to the upside as per the following technical analysis that would marry with the two Federal Reserve official's comments on Monday that had issued a stark reminder that interest rates will have to keep rising, no matter what investors have priced in.
USD/JPY weekly chart
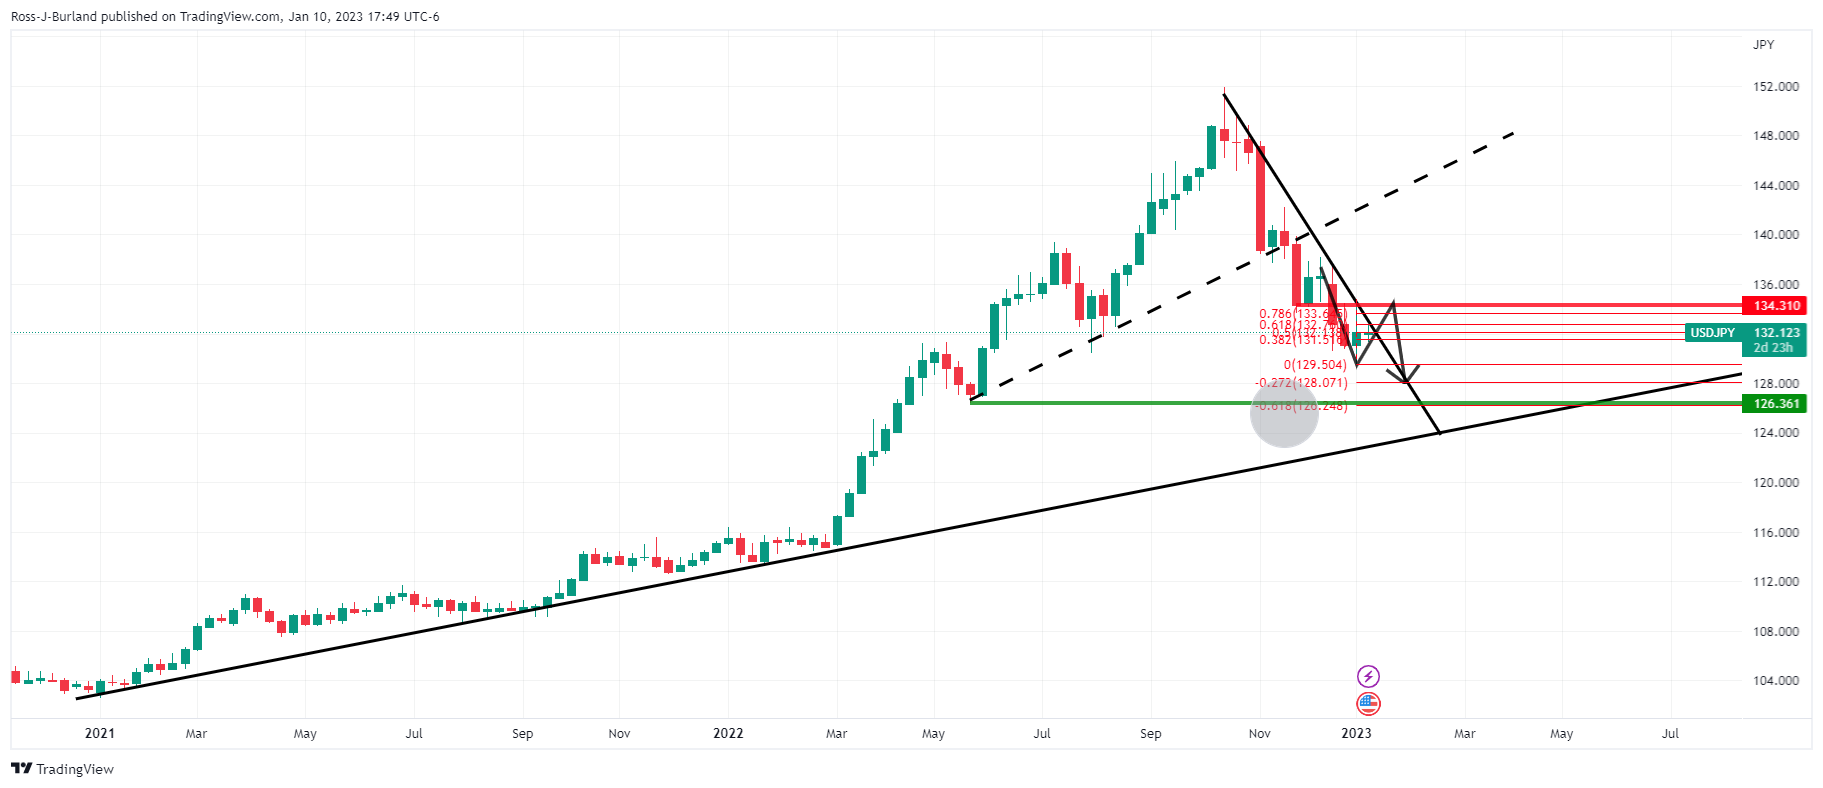
The weekly outlook is bearish while on the front side of the bearish trendline and a target of the 126's could be in order for the medium term. We have already seen a correction of the bearish impulse and selling pressure from the 134s, the prior support structure and the 50% mean reversion mark into the advances.
USD/JPY daily chart
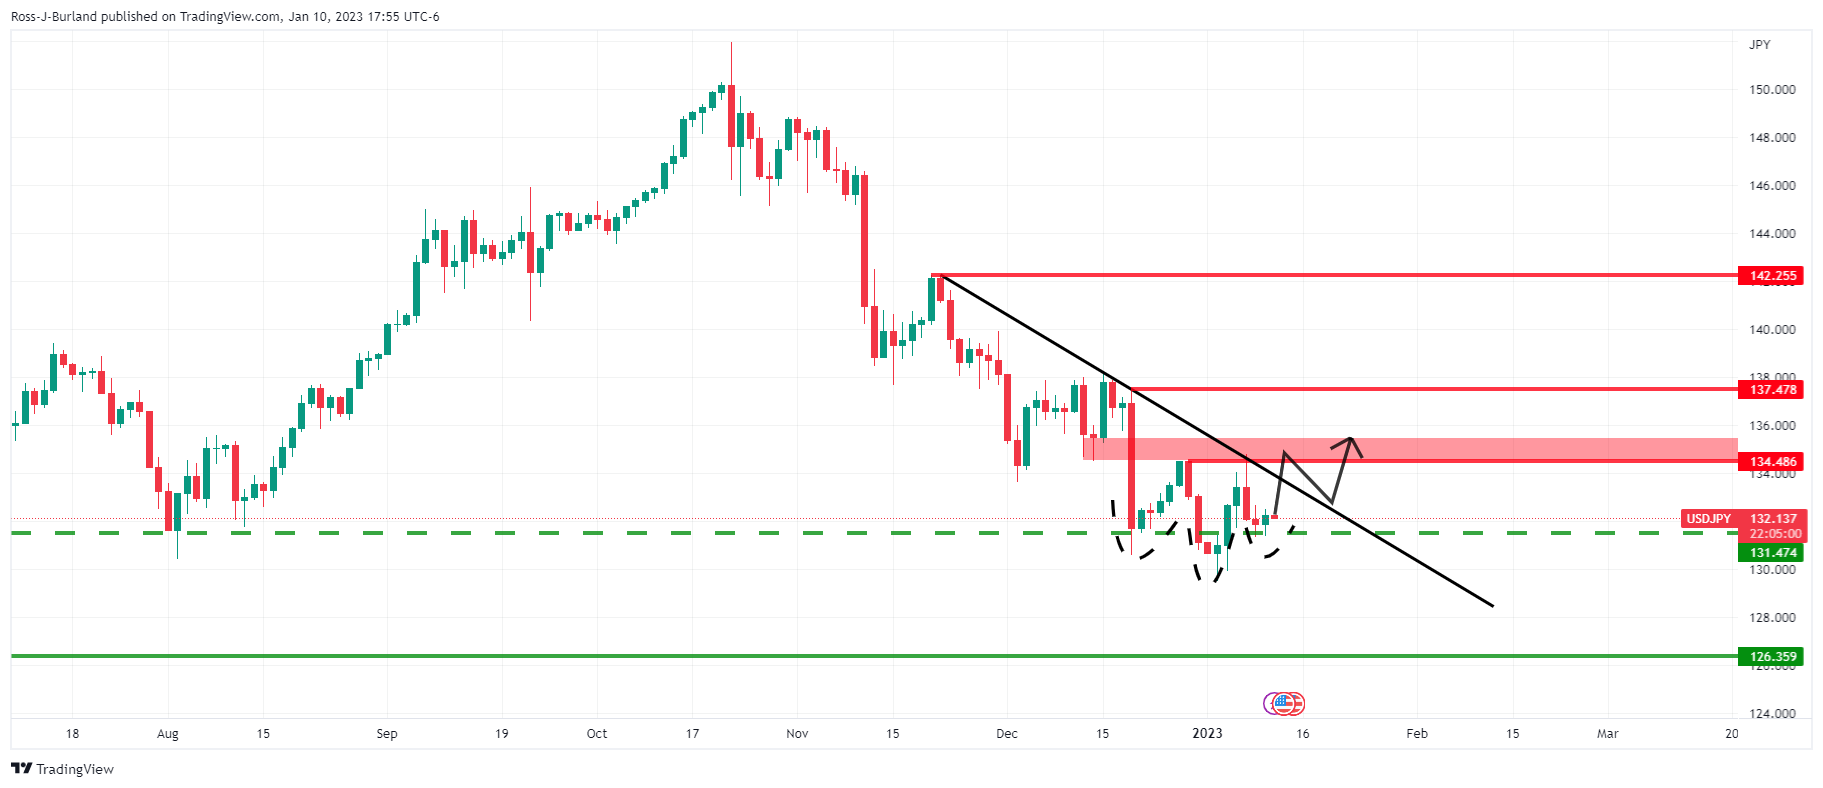
With that being said, the inverse head and shoulders pattern that is starting to draw the right-hand shoulder is a bullish bottoming formation. A break of the trendline resistance is needed and a subsequent break into the 135s would confirm a change in character from bearish to meanwhile bullish.
USD/JPY H4 chart
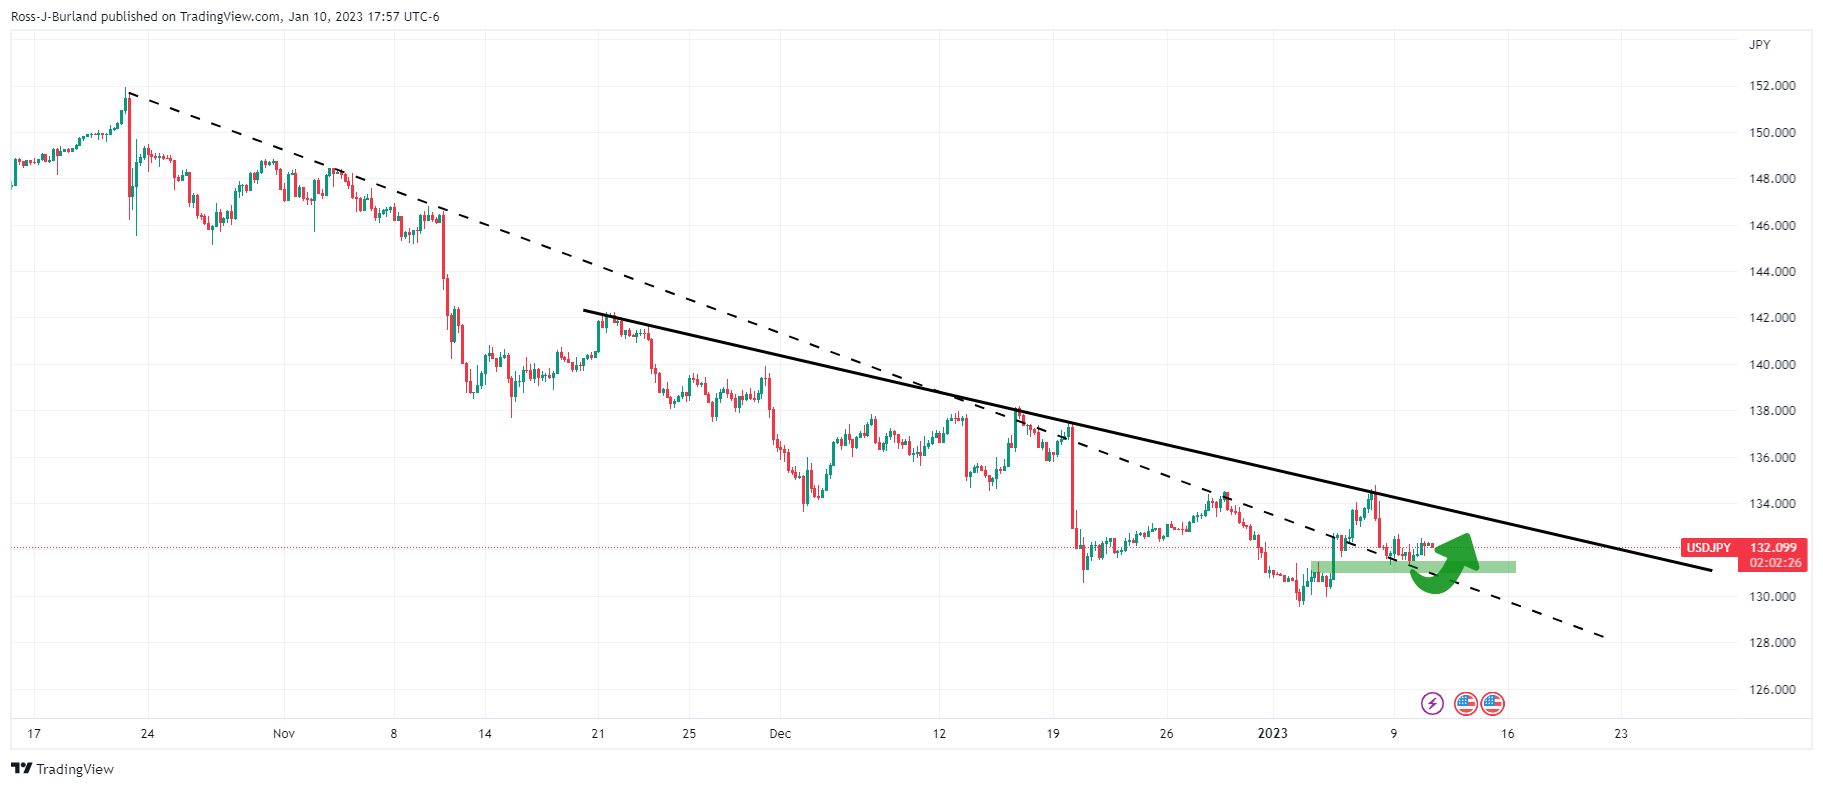
Having already broken a daily bear trendline, the bulls are leaning against 4-hour support as illustrated above and below:
The W-formation's neckline is holding up so far and this could lead to a burst to the upside as trapped bears throw in the towel and buy back their positions on repeated failures to break support.
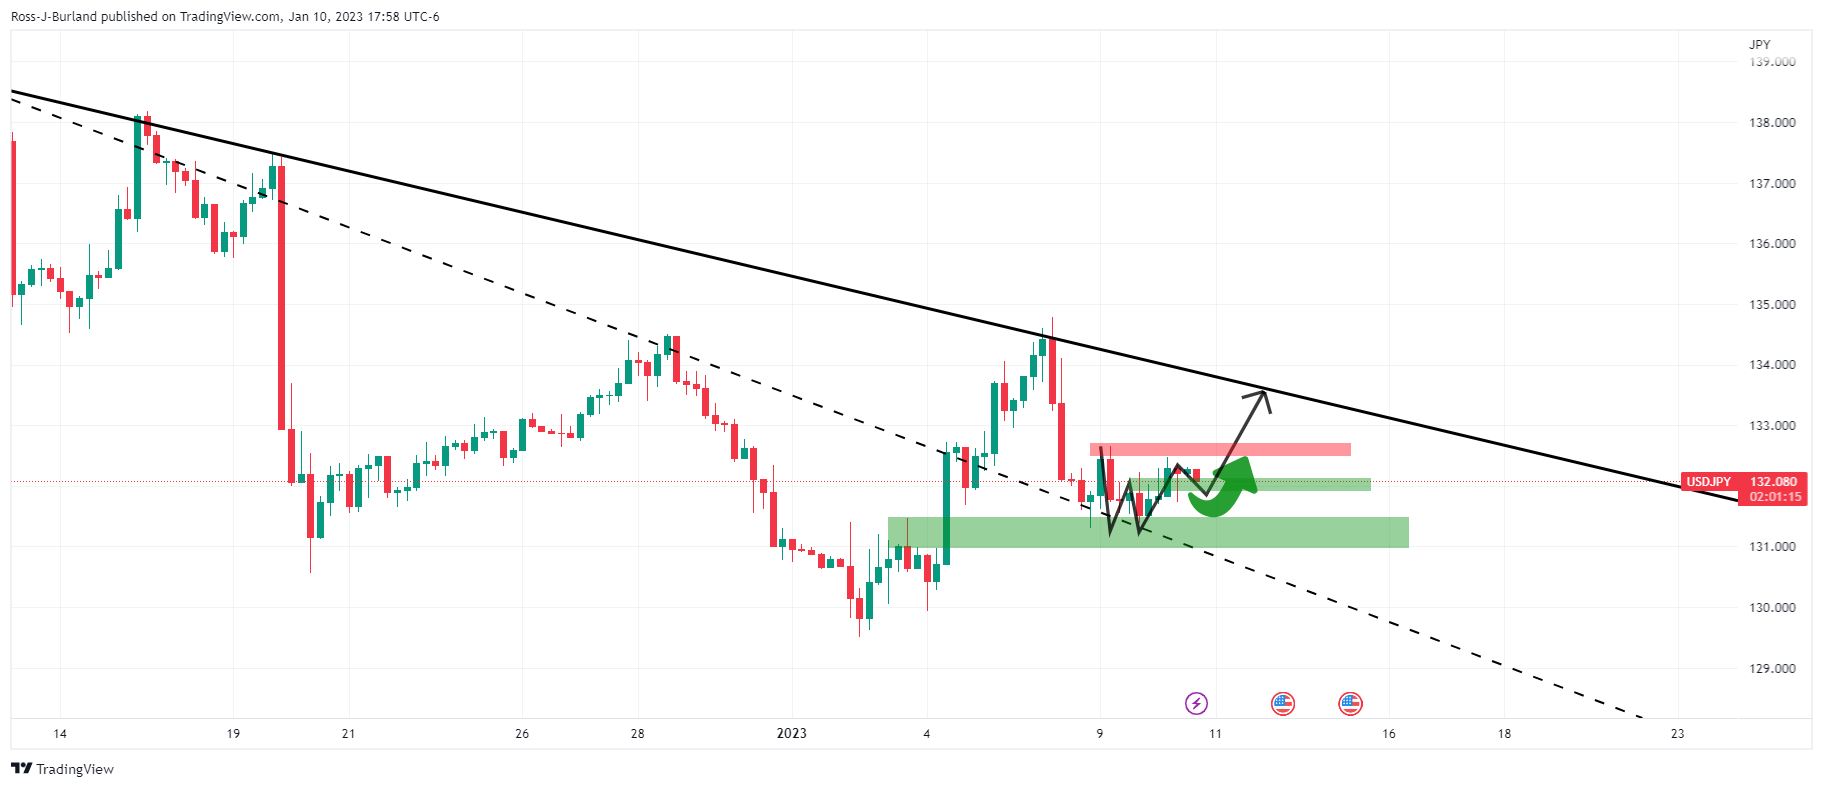
Zoomed in...
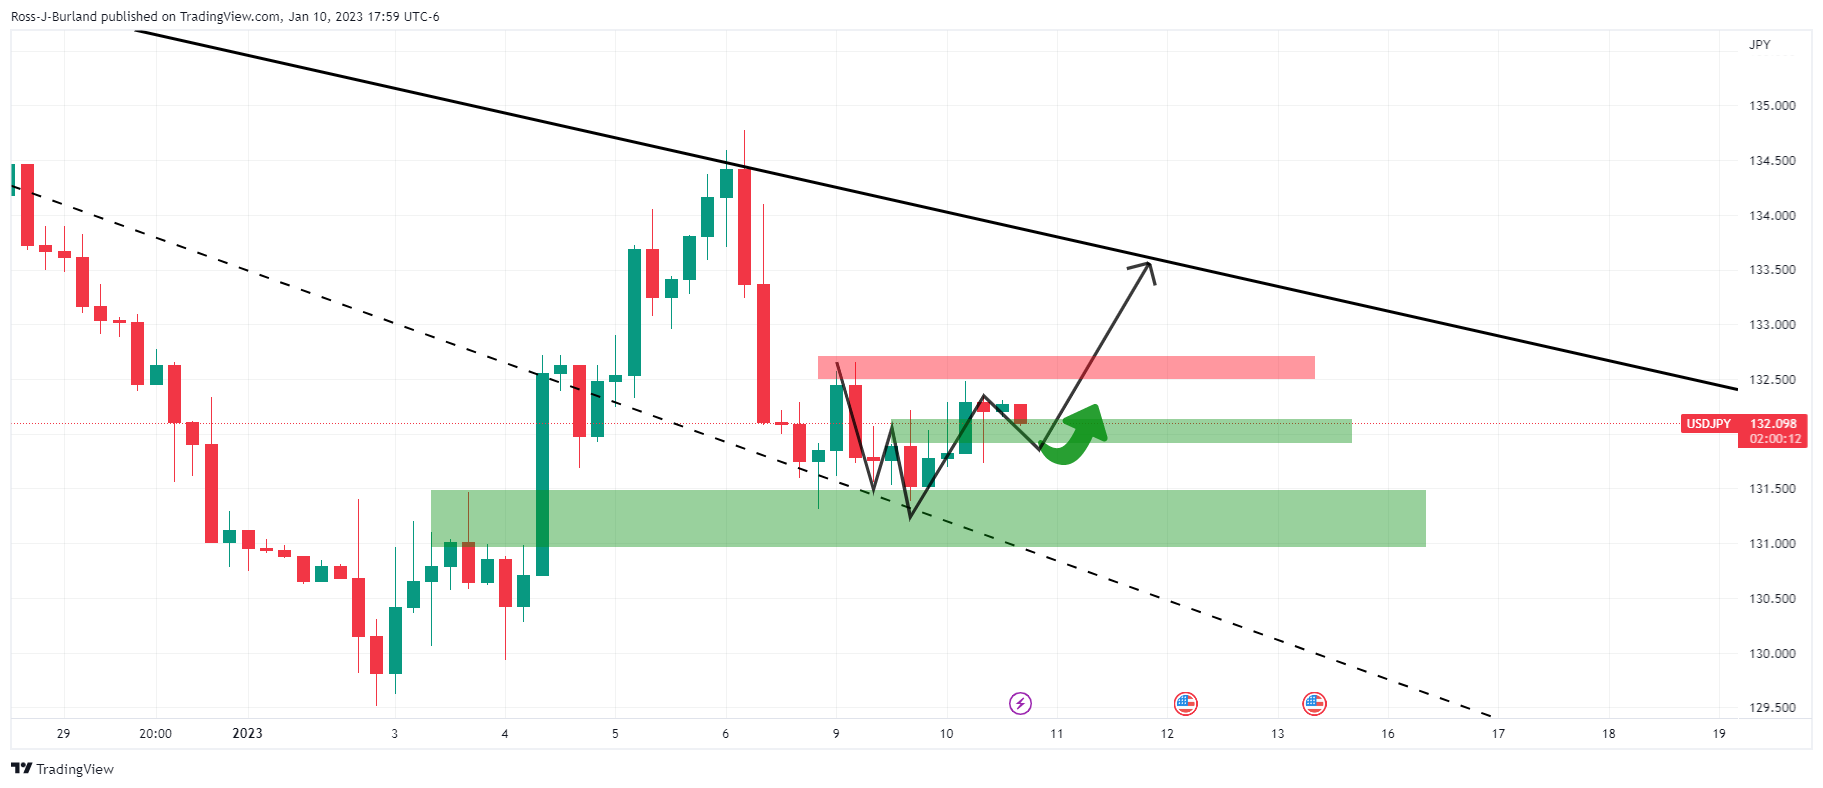
USD/JPY H1 chart
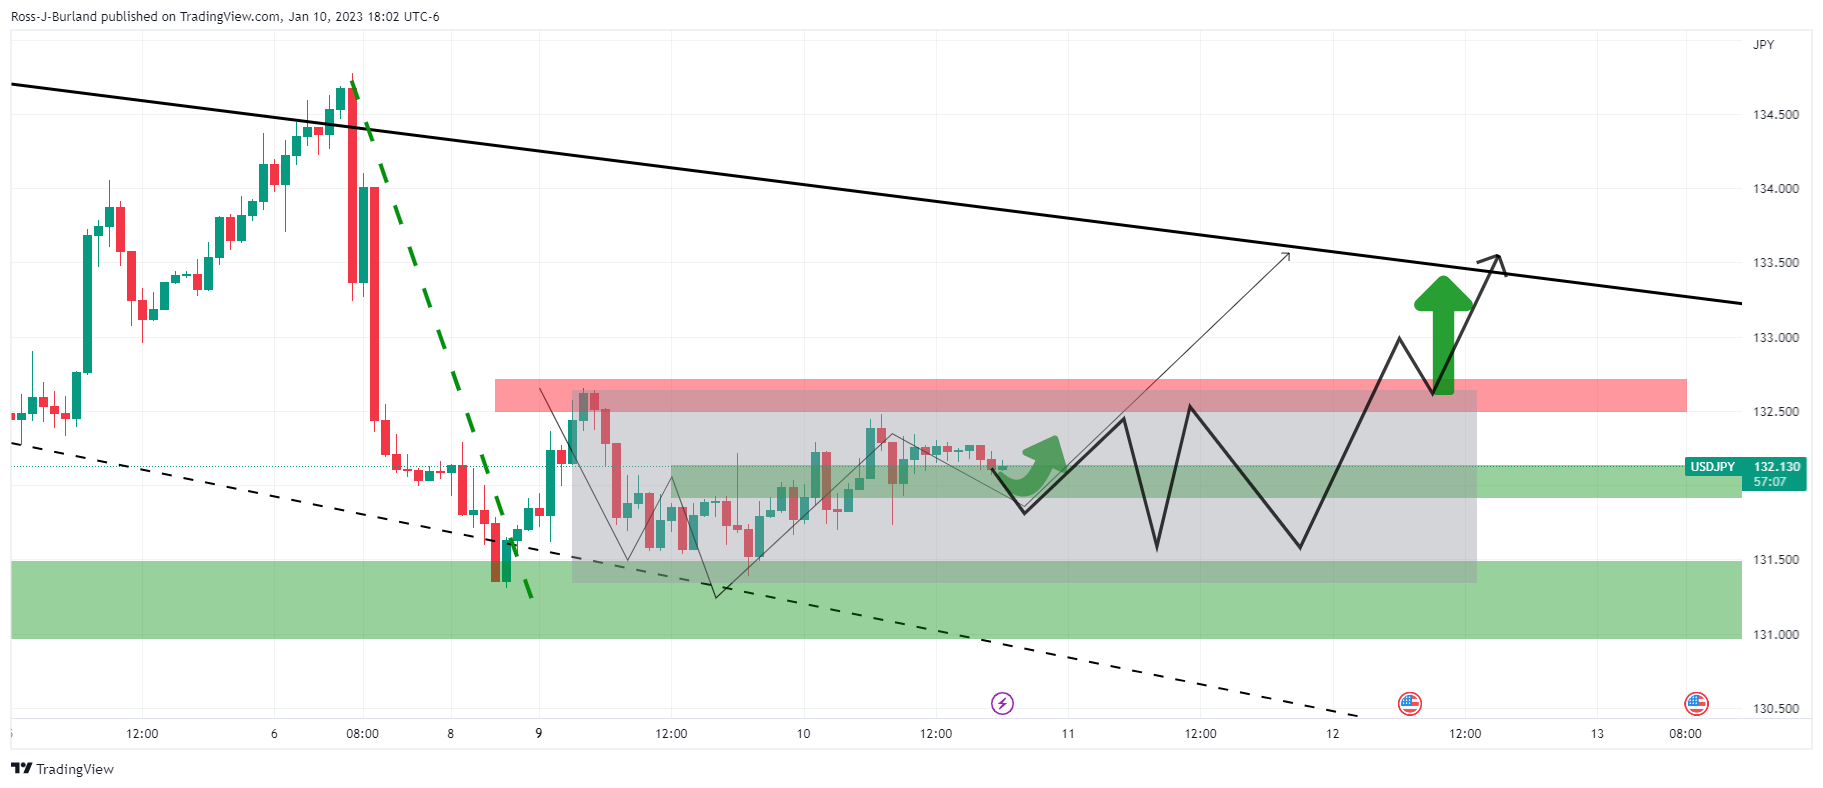
Meanwhile, the price is in a sideways consolidation between hourly resistance and support. We have red news on the calendar on Thursday so it will not be surprising to see the forex space tread water until the event that might use the data as a catalyst. In the case of USD/JPY, a break of resistance would be expected to see the price volt through price imbalances and target a break of the trendline resistance.
Author

Ross J Burland
FXStreet
Ross J Burland, born in England, UK, is a sportsman at heart. He played Rugby and Judo for his county, Kent and the South East of England Rugby team.


