- USD/JPY will remain subdued as traders await the US Federal Reserve.
- Caution is warranted, given the fact that oscillators are giving mixed signals.
- USD/JPY Price Analysis: Short-term, a bearish continuation is likely; otherwise, buyers can reclaim 133.00.
USD/JPY remains in choppy trading price action, with investors eyeing Wednesday’s US Federal Reserve decision. At the time of typing, the USD/JPY pair exchanges hands at around 132.50s after traveling from a daily low of 132.25 and hitting a high at 133.00.
USD/JPY Price action
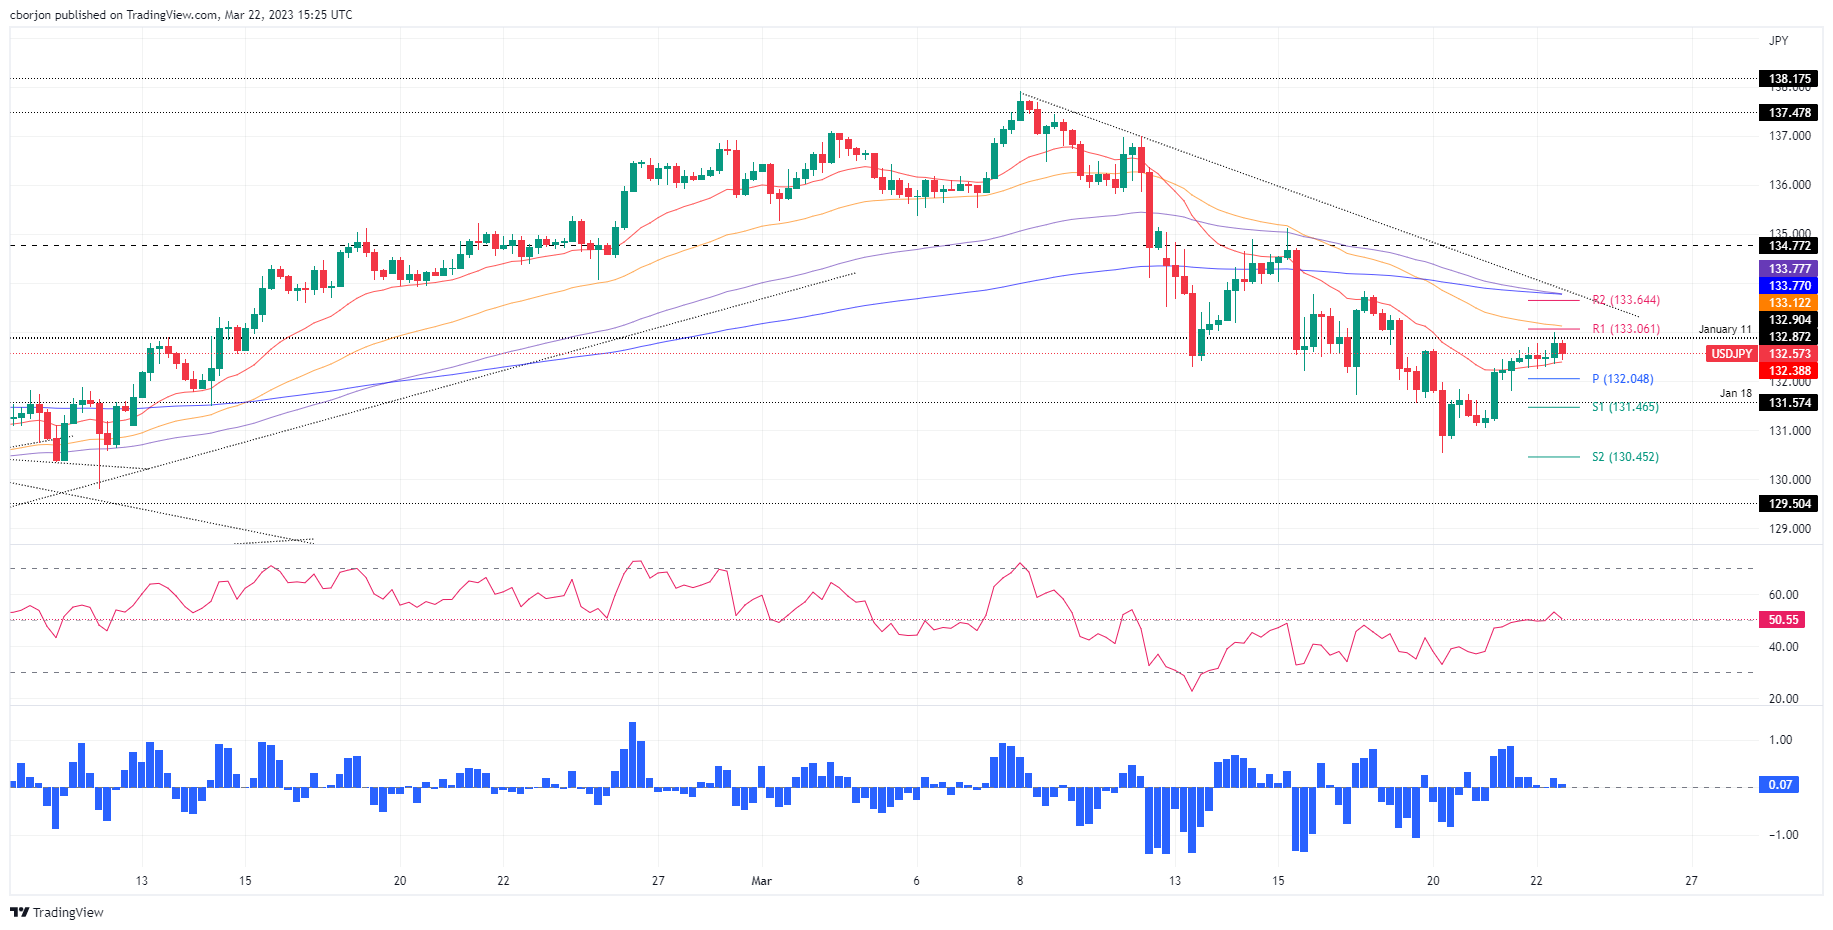
The USD/JPY pair trades nearby the weekly highs, though it remains sideways. The Exponential Moving Averages (EMAs) in the daily chart turned flat, while oscillators like the Relative Strength Index (RSI) and the Rate of Change (RoC) give mixed signals.
In the short-term, the USD/JPY 4-hour chat paints the pair as downward biased, trading below the 50, 100, and 200-EMAs. Also, a three-week-old downslope resistance trendline would cap any rallies should the USD/JPY exceed the 133.50 area.
For a bearish continuation, the USD/JPY is backed by oscillators, like the RSI is about to turn bearish, while the RoC portrays buying pressure waning. That said, the USD/JPY first support would be the 20-EMA at 132.38. A breach of the latter could send the pair to the daily pivot at 132.04, followed by a drop to the S1 pivot point at 131.46. Once cleared, the USD/JPY would challenge the 131.00 figure.
In an alternate scenario, the USD/JPY first resistance would be the R1 pivot at 133.06. Once broken, the pair would immediately test the 50-EMA at 133.11, followed by the R2 daily pivot point at 133.64, ahead of the confluence of the 100/200-EMAs at 133.76/77.
USD/JPY 4-hour chart
USD/JPY Technical levels
Information on these pages contains forward-looking statements that involve risks and uncertainties. Markets and instruments profiled on this page are for informational purposes only and should not in any way come across as a recommendation to buy or sell in these assets. You should do your own thorough research before making any investment decisions. FXStreet does not in any way guarantee that this information is free from mistakes, errors, or material misstatements. It also does not guarantee that this information is of a timely nature. Investing in Open Markets involves a great deal of risk, including the loss of all or a portion of your investment, as well as emotional distress. All risks, losses and costs associated with investing, including total loss of principal, are your responsibility. The views and opinions expressed in this article are those of the authors and do not necessarily reflect the official policy or position of FXStreet nor its advertisers. The author will not be held responsible for information that is found at the end of links posted on this page.
If not otherwise explicitly mentioned in the body of the article, at the time of writing, the author has no position in any stock mentioned in this article and no business relationship with any company mentioned. The author has not received compensation for writing this article, other than from FXStreet.
FXStreet and the author do not provide personalized recommendations. The author makes no representations as to the accuracy, completeness, or suitability of this information. FXStreet and the author will not be liable for any errors, omissions or any losses, injuries or damages arising from this information and its display or use. Errors and omissions excepted.
The author and FXStreet are not registered investment advisors and nothing in this article is intended to be investment advice.
Recommended content
Editors’ Picks

EUR/USD keeps range below 1.0900 ahead of US Retail Sales data
EUR/USD is keeping its range below 1.0900 in the European session on Monday. The US Dollar steadies as traders exercise caution before US Retail Sales data due later in the day. Meanwhile, the Euro stays defensive ahead of Tuesday's German vote on fiscal reforms and US-Russia talks.

GBP/USD retakes 1.2950, with Fed-BoE meetings on tap
GBP/USD retakes 1.2950 in European trading on Monday. The pair advances amid a subdued US Dollar. The risk mood stays cautious amid looming concerns over a trade war and Middle East conflict, capping the pair's upside. The focus shifts to the US Retail Sales data ahead of this week's BoE and Fed event risks.

Gold price holds gains just below $3,000, US data eyed
Gold price holds gains below $3,000 in the European session on Monday, staying close to all-time peak as rising trade tensions underpin safe-haven demand. Bets that the Fed will cut rates several times in 2025 lend additional support to the XAU/USD.

Five Fundamentals for the week: Fed leads central bank parade as uncertainty remains extreme Premium
Central bank bonanza – perhaps its is not as exciting as comments from the White House, but central banks still have sway. They have a chance to share insights about the impact of tariffs, especially when they come from the world's most powerful central bank, the Federal Reserve.

Top Formula 1 crypto sponsors rally, racing fans gain from Binance Coin, OKB, ApeCoin and Crypto.com
The 2025 Formula 1 season kicked off in Australia last week with a lineup of crypto sponsors for half of the teams. Racing giants are powered by sponsors like crypto exchanges Binance, OKX, ApeCoin, and Crypto.com, among other NFT and trading platforms. Binance Coin, OKX, ApeCoin, Crypto.com, and Alchemy Pay’s tokens rallied as crypto sponsors made their mark in the racing event.

The Best brokers to trade EUR/USD
SPONSORED Discover the top brokers for trading EUR/USD in 2025. Our list features brokers with competitive spreads, fast execution, and powerful platforms. Whether you're a beginner or an expert, find the right partner to navigate the dynamic Forex market.