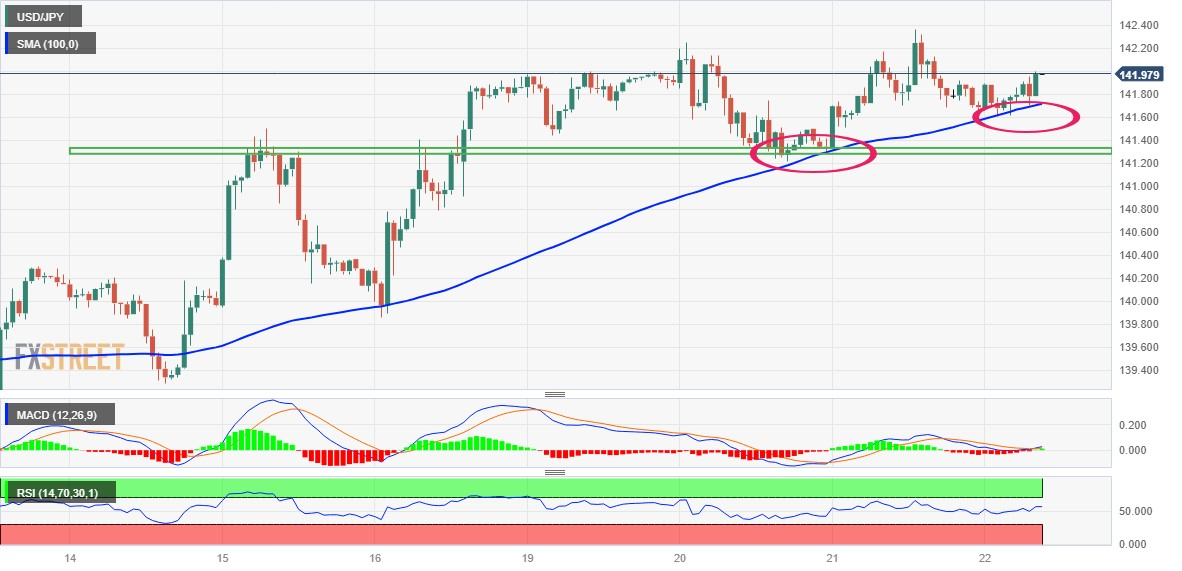
- USD/JPY attracts some buying near the 100-hour SMA for the second straight day on Thursday.
- The price action favours bullish traders and supports prospects for a further appreciating move.
- A sustained break below the weekly trading range support is needed to negate the positive bias.
The USD/JPY pair finds support near the 100-hour Simple Moving Average (SMA) for the second straight day on Thursday and climbs back to the 142.00 neighbourhood during the early European session. Spot prices, however, remain below the YTD peak touched on Wednesday and well within a familiar trading range held since the beginning of the current week.
Against the backdrop of the recent appreciating move witnessed over the past two weeks or so, the rang-bound price action might still be categorized as a bullish consolidation phase. Furthermore, last week's sustained breakout through a horizontal resistance near the 141.00 mark supports prospects for additional gains. That said, the Relative Strength Index (RSI) on the daily chart is hovering just below the overbought territory and holding back traders from placing fresh bullish bets around the USD/JPY pair.
Nevertheless, spot prices remain on track to build on over a one-month-old uptrend and climb further beyond the 142.35 area, or the highest level since November 2022 touched on Wednesday, towards reclaiming the 143.00 round figure. The upward trajectory could get extended further towards the next relevant hurdle near the 143.75 region en route to the 144.00 mark. The USD/JPY pair might eventually climb to the 144.30-144.35 intermediate hurdle, above which bulls might aim to reclaim the 145.00 psychological mark.
On the flip side, the 100-hour SMA, currently around the 141.670-141.65 area, now seems to protect the immediate downside ahead of the 141.30-141.20 area, or the weekly low. A convincing break below the latter might prompt some technical selling and drag the USD/JPY pair below the 141.00 mark, towards the 140.60-140.55 horizontal support. Any subsequent decline might attract fresh buyers near the 140.25 zone and remain limited near the 140.00 psychological mark. The latter should act as a strong base for spot prices, which if broken might shift the bias in favour of bearish traders.
USD/JPY 1-hour chart
Key levels to watch
Information on these pages contains forward-looking statements that involve risks and uncertainties. Markets and instruments profiled on this page are for informational purposes only and should not in any way come across as a recommendation to buy or sell in these assets. You should do your own thorough research before making any investment decisions. FXStreet does not in any way guarantee that this information is free from mistakes, errors, or material misstatements. It also does not guarantee that this information is of a timely nature. Investing in Open Markets involves a great deal of risk, including the loss of all or a portion of your investment, as well as emotional distress. All risks, losses and costs associated with investing, including total loss of principal, are your responsibility. The views and opinions expressed in this article are those of the authors and do not necessarily reflect the official policy or position of FXStreet nor its advertisers. The author will not be held responsible for information that is found at the end of links posted on this page.
If not otherwise explicitly mentioned in the body of the article, at the time of writing, the author has no position in any stock mentioned in this article and no business relationship with any company mentioned. The author has not received compensation for writing this article, other than from FXStreet.
FXStreet and the author do not provide personalized recommendations. The author makes no representations as to the accuracy, completeness, or suitability of this information. FXStreet and the author will not be liable for any errors, omissions or any losses, injuries or damages arising from this information and its display or use. Errors and omissions excepted.
The author and FXStreet are not registered investment advisors and nothing in this article is intended to be investment advice.
Recommended content
Editors’ Picks

EUR/USD extends slide toward 1.0300, touches new two-year low
EUR/USD stays under bearish pressure and trades at its lowest level since December 2022 below 1.0350 on Thursday. The US Dollar benefits from the risk-averse market atmosphere and the upbeat Jobless Claims data, causing the pair to stretch lower.

GBP/USD slumps to multi-month lows below 1.2400 on broad USD strength
Following an earlier recovery attempt, GBP/USD reversed its direction and declined to its weakest level in nearly eight months below 1.2400. The renewed US Dollar (USD) strength on worsening risk mood weighs on the pair as trading conditions normalize after the New Year break.

Gold benefits from risk aversion, climbs above $2,640
Gold gathers recovery momentum and trades at a two-week-high above $2,640 in the early American session on Thursday. The precious metal benefits from the sour market mood and the pullback seen in the US Treasury bond yields.

These 5 altcoins are rallying ahead of $16 billion FTX creditor payout
FTX begins creditor payouts on January 3, in agreement with BitGo and Kraken, per an official announcement. Bonk, Fantom, Jupiter, Raydium and Solana are rallying on Thursday, before FTX repayment begins.

Three Fundamentals: Year-end flows, Jobless Claims and ISM Manufacturing PMI stand out Premium
Money managers may adjust their portfolios ahead of the year-end. Weekly US Jobless Claims serve as the first meaningful release in 2025. The ISM Manufacturing PMI provides an initial indication ahead of Nonfarm Payrolls.

Best Forex Brokers with Low Spreads
VERIFIED Low spreads are crucial for reducing trading costs. Explore top Forex brokers offering competitive spreads and high leverage. Compare options for EUR/USD, GBP/USD, USD/JPY, and Gold.
