USD/JPY Price Analysis: Climbs back closer to mid-147.00s, seems poised to retest YTD top
- USD/JPY recovers nearly 100 pips from the daily low and refreshes the daily high in the last hour.
- A combination of factors undermines the JPY and assists the pair to attract some dip-buying.
- Intervention fears could benefit the JPY and cap any further gains amid a modest USD pullback.

The USD/JPY pair attracts some dip-buying in the vicinity of mid-146.00s, or the 200-hour Simple Moving Average (SMA) on Friday and stalls this week's corrective pullback from its highest level since November 2022. Spot prices build on the steady intraday ascent through the early part of the European session and climb to a fresh daily peak, around the 147.45 region in the last hour.
A downward revision of Japan's second-quarter GDP growth ensures that the Bank of Japan (BoJ) will stick to its ultra-loose policy setting, which undermines the Japanese Yen (JPY) and lends some support to the USD/JPY pair. That said, speculations that Japanese authorities will intervene in the markets to prop up the domestic currency and revive safe-haven demand should limit losses for the JPY. Apart from this, a modest US Dollar (USD) pullback from a six-month top, triggered by retreating US Treasury bond yields, might hold back bulls from placing aggressive bets around the major.
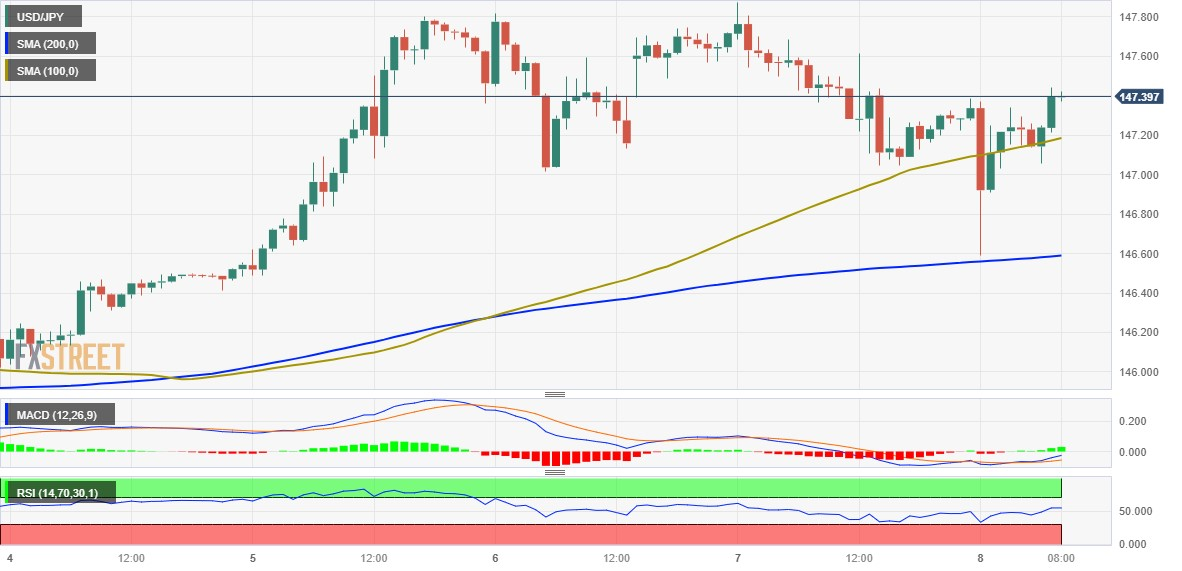
The prospects for further policy tightening by the Federal Reserve (Fed), however, favour the USD bulls and suggest that the path of least resistance for the USD/JPY pair is to the upside. Moreover, technical indicators on the daily chart are holding comfortably in the positive territory and are still far from being in the overbought zone, validating the positive outlook. Hence, a subsequent strength back towards retesting the YTD peak, around the 147.80-147.85 region, looks like a distinct possibility. Some follow-through buying beyond the 148.00 mark will set the stage for additional gains.
On the flip side, the 147.00 round figure now seems to protect the immediate downside ahead of the 200-period SMA on the 4-hour chart, just ahead of the mid-146.00s. A convincing break below might prompt some technical selling and pave the way for some meaningful corrective decline. The USD/JPY pair might then accelerate the fall towards the 146.20 intermediate support en route to the 146.00 mark and the 145.45 horizontal support. The downward trajectory could get extended further towards the 145.00 psychological mark and the monthly low, around the 144.45 region.
USD/JPY 1-hour chart
Technical levels to watch
Author

Haresh Menghani
FXStreet
Haresh Menghani is a detail-oriented professional with 10+ years of extensive experience in analysing the global financial markets.


