|

USD/JPY Price Analysis: Climbs above 136.50 despite upbeat Japan’s GDP

  • USD/JPY has climbed above 136.50 as the USD Index is gathering strength for surpassing the immediate resistance of 102.70.
  • Preliminary Japan’s Q1 GDP beat estimates but failed to strengthen the Japanese Yen.
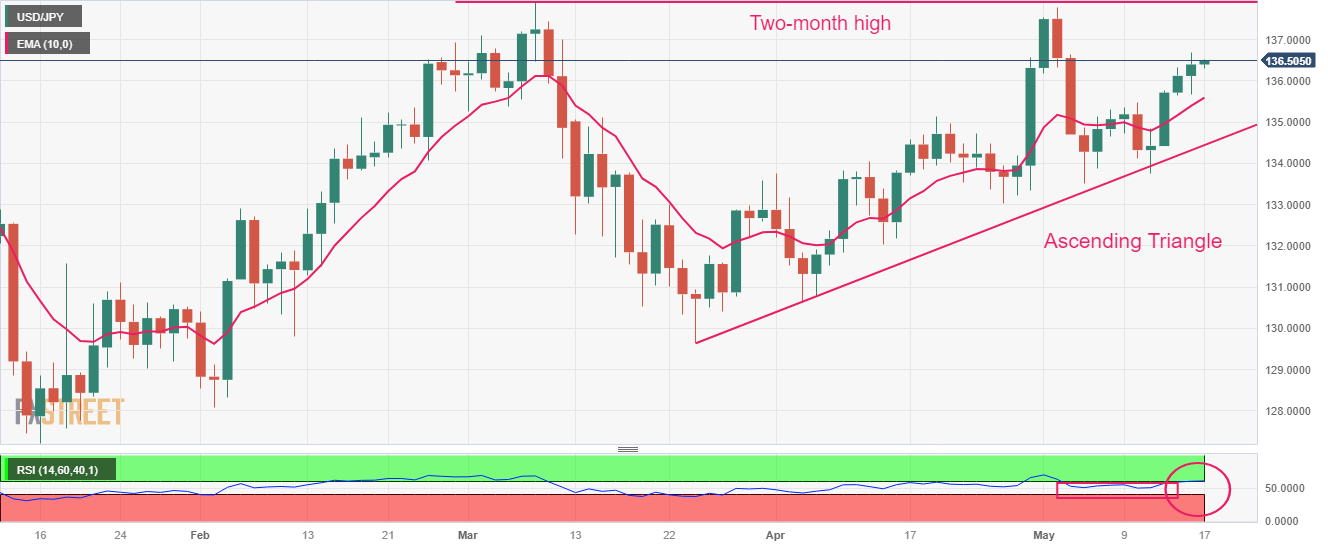
  • USD/JPY is marching towards its two-month high resistance plotted at 137.91.

The USD/JPY pair has resumed its upside journey after a marginal correction below 136.50 in the Asian session. The major is aiming to recapture Tuesday’s high at 136.68 as the Japanese Yen has failed to find strength despite upbeat Q1 Gross Domestic Product (GDP) numbers. Preliminary Q1 GDP accelerated by 0.4% vs. the estimates of 0.1%. In the last quarter, the GDP growth remained stagnant.

The US Dollar Index (DXY) has turned sideways after failing to extend recovery above 102.70 despite the absence of approval for an extension in the US borrowing cap to safeguard the US Treasury from default for obligated payments.

Later this week, Japan’s National Consumer Price Index (CPI) data (April) will be keenly watched. Headline CPI is seen softening to 2.5% from the former release of 3.2%. Also, the core inflation is expected to decelerate to 3.4% against the prior figure of 3.8%.

USD/JPY is marching towards its two-month high resistance plotted from March 08 high at 137.91. The asset is auctioning in an Ascending Triangle chart pattern on a daily scale, which signals a decline in volatility. Upward-sloping trendline from March 24 low at 129.64 will continue to act as a support for the US Dollar bulls.

Advancing 10-period Exponential Moving Average (EMA) at 135.60 indicates strength in USD/JPY.

The Relative Strength Index (RSI) (14) is making efforts for shifting into the bullish range of 60.00-80.00, which will activate the upside momentum.

Should the asset break above Tuesday’s high at 136.68, US Dollar bulls will drive the pair toward March 02 high at 137.10 and a two-month high at 137.91.

On the flip side, a downside move below May 10 high at 135.47 will strengthen the Japanese Yen bulls. This would drag the USD/JPY pair towards May 11 high at 134.84 followed by May 11 low at 133.74.

USD/JPY daily chart

USD/JPY

Overview
Today last price136.5
Today Daily Change0.10
Today Daily Change %0.07
Today daily open136.4
 
Trends
Daily SMA20135.01
Daily SMA50133.74
Daily SMA100132.98
Daily SMA200137.04
 
Levels
Previous Daily High136.68
Previous Daily Low135.68
Previous Weekly High135.77
Previous Weekly Low133.74
Previous Monthly High136.56
Previous Monthly Low130.63
Daily Fibonacci 38.2%136.3
Daily Fibonacci 61.8%136.06
Daily Pivot Point S1135.82
Daily Pivot Point S2135.24
Daily Pivot Point S3134.81
Daily Pivot Point R1136.83
Daily Pivot Point R2137.26
Daily Pivot Point R3137.84

Author

Sagar Dua

Sagar Dua

FXStreet

Sagar Dua is associated with the financial markets from his college days. Along with pursuing post-graduation in Commerce in 2014, he started his markets training with chart analysis.

More from Sagar Dua
Share:

Editor's Picks

EUR/USD flirts with weekly lows near 1.1770

EUR/USD now comes under further selling pressure, breaking below the 1.1800 support to challenge the area of weekly throughs near 1.1770 on Thursday. The pair’s decline comes in response to marked gains in the US Dollar amid steady geopolitical tensions. Ealier in the day, the ECB’s Lagarde delivered cautious remarks, although the currency remained apathetic.

GBP/USD threatens the 200-day SMA near 1.3440

GBP/USD rapidly leaves behind Wednesday’s strong advance, coming under heavy pressure and retesting the 1.3440 zone, where the critical 200-day SMA is located. Cable’s deep pullback follows the strong gains in the Greenback, while investors continue to pencil in a potential BoE rate cut in March.

Gold trims gains, slips back to around $5,170

Gold is now facing some downside pressure, hovering around the $5,170 region on Thursday. The yellow metal surrenders part of its earlier gains on the back of the resurgence of the buying interest in the Greenback. In the meantime, geopolitical tensions in the Middle East continue to limit the downside potential for now.

Stellar: Relief bounce fades as bearish undertone persists

Stellar is trading around $0.16 at the time of writing on Thursday after rebounding more than 8% in the previous day. Derivatives data paints a negative picture as XLM’s short bets hit a monthly high while Open Interest continues to decline.

Changing the game: International implications of recent tariff developments

The Supreme Court ruling on International Emergency Economic Powers Act (IEEPA) tariffs provides limited relief for the rest of the world, with weighted average tariff rates modestly lower.

Bitcoin steadies as traders eye US–Iran talks

Bitcoin (BTC) price is stabilizing around $68,000 at the time of writing on Thursday after a 6.2% relief rally the previous day amid a broader downward trend.