- USD/JPY scales higher for the seventh straight day and hits a fresh YTD peak on Tuesday.
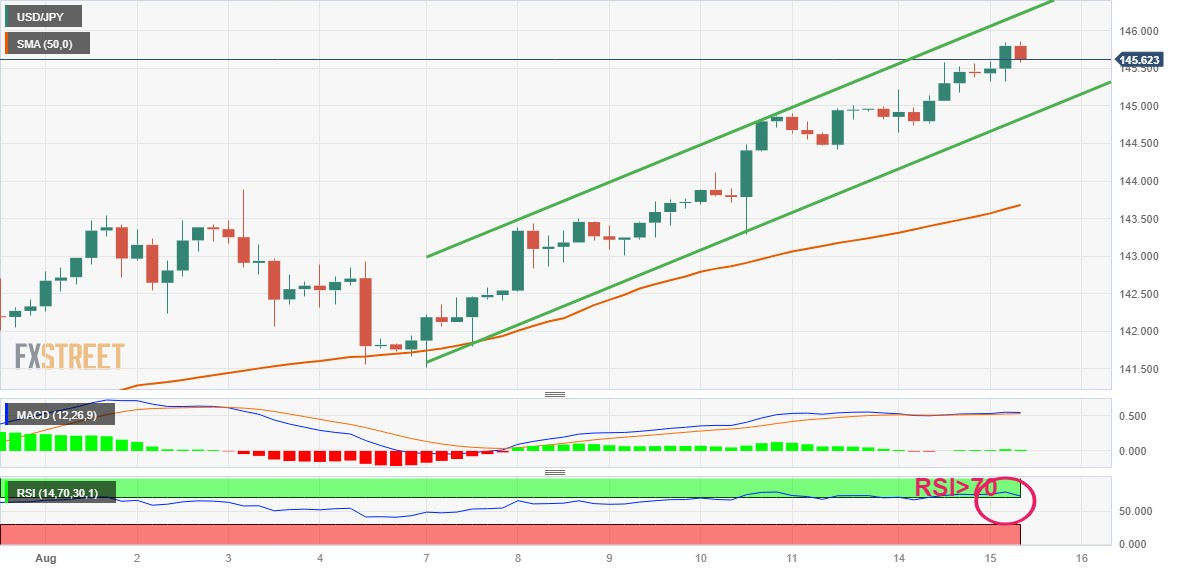
- The recent move up along an ascending channel points to a well-established positive trend.
- Intervention fears hold back bulls from placing fresh bets and cap the upside for the major.
The USD/JPY pair gains some positive traction for the seventh successive day on Tuesday and climbs to its highest level since November 2022, around the 145.85 region during the early part of the European session.
The Japanese Yen (JPY) continues with its underperformance in the wake of a more dovish stance adopted by the Bank of Japan (BoJ), which is the only central bank in the world to maintain a negative benchmark interest rate. This, in turn, is seen as a key factor acting as a tailwind for the USD/JPY pair amid the underlying bullish tone around the US Dollar (USD), supported by expectations that the Federal Reserve (Fed) will keep rates higher for longer.
Even the upbeat Japanese GDP report, showing that the economy expanded by 1.5% during the second quarter and a 6% annualized pace, fails to provide any respite to the JPY. That said, speculations for a possible intervention by Japanese authorities to curb any further fall in the domestic currency hold back bulls from placing fresh bets. The fundamental backdrop, however, suggests that the path of least resistance for the USD/JPY pair is to the upside.
From a technical perspective, the recent strong move-up witnessed over the past one-and-half week or so has been along an upward sloping trend-channel. This, along with last week's breakout through the 145.00 psychological mark, adds credence to the positive outlook for the USD/JPY pair. That said, the Relative Strength Index (RSI) on the 1-hour chart is flashing slightly overbought conditions and warrants caution for bullish traders.
Hence, any subsequent move up is more likely to confront stiff resistance and remain capped near the 146.00 mark, representing the top boundary of the aforementioned trend channel. The said handle should act as a pivotal point, which if cleared will be seen as a fresh trigger for bullish traders and lift the USD/JPY pair beyond an intermediate hurdle near the 146.35 area, towards the 146.75-146.80 region en route to the 147.00 round figure.
On the flip side, any meaningful corrective decline might now find decent support near the 145.00 resistance breakpoint. This is followed by the lower end of the ascending channel, currently pegged around the 144.60 region. A convincing break below the latter might negate the constructive setup and shift the near-term bias in favour of bearish traders. The subsequent fall could then drag the USD/JPY pair to the 144.00 mark and then to the 143.30 horizontal support.
USD/JPY 4-hour chart
Technical levels to watch
Information on these pages contains forward-looking statements that involve risks and uncertainties. Markets and instruments profiled on this page are for informational purposes only and should not in any way come across as a recommendation to buy or sell in these assets. You should do your own thorough research before making any investment decisions. FXStreet does not in any way guarantee that this information is free from mistakes, errors, or material misstatements. It also does not guarantee that this information is of a timely nature. Investing in Open Markets involves a great deal of risk, including the loss of all or a portion of your investment, as well as emotional distress. All risks, losses and costs associated with investing, including total loss of principal, are your responsibility. The views and opinions expressed in this article are those of the authors and do not necessarily reflect the official policy or position of FXStreet nor its advertisers. The author will not be held responsible for information that is found at the end of links posted on this page.
If not otherwise explicitly mentioned in the body of the article, at the time of writing, the author has no position in any stock mentioned in this article and no business relationship with any company mentioned. The author has not received compensation for writing this article, other than from FXStreet.
FXStreet and the author do not provide personalized recommendations. The author makes no representations as to the accuracy, completeness, or suitability of this information. FXStreet and the author will not be liable for any errors, omissions or any losses, injuries or damages arising from this information and its display or use. Errors and omissions excepted.
The author and FXStreet are not registered investment advisors and nothing in this article is intended to be investment advice.
Recommended content
Editors’ Picks
EUR/USD retreats to 1.0700 area following post-PCE jump
![EUR/USD retreats to 1.0700 area following post-PCE jump](https://editorial.fxstreet.com/images/Markets/Currencies/Majors/EURUSD/photo-of-the-american-and-euro-banknotes-57153806_XtraSmall.jpg)
After spiking to a daily high of 1.0720 with the immediate reaction to US PCE inflation data, EUR/USD lost its traction and declined to the 1.0700 area. Investors remain cautious ahead of this weekend's French election and make it difficult for the Euro to gather strength.
GBP/USD stays below 1.2650 after US inflation data
![GBP/USD stays below 1.2650 after US inflation data](https://editorial.fxstreet.com/images/Markets/Currencies/Majors/GBPUSD/iStock-688526532_XtraSmall.jpg)
GBP/USD struggles to preserve its bullish momentum and trades below 1.2650 in the American session on Friday. Earlier in the day, the data from the US showed that the annual core PCE inflation declined to 2.6% in May, limiting the USD's upside and helping the pair hold its ground.
Gold keeps its daily gains near $2,330 following US PCE data
![Gold keeps its daily gains near $2,330 following US PCE data](https://editorial.fxstreet.com/images/Markets/Commodities/Metals/Gold/stacked-gold-bars-13094022_XtraSmall.jpg)
Gold prices maintain their constructive bias around $2,330 after US inflation readings gauged by the PCE matched consensus in May and US yields advance slightly across the curve.
BTC struggles around the $62,000 level
![BTC struggles around the $62,000 level](https://editorial.fxstreet.com/images/Markets/Currencies/Cryptocurrencies/cryptocurrenciesusd_XtraSmall.jpg)
Bitcoin price faces pullback resistance at the lower band of the descending wedge around $62,000. Ethereum price finds support at $3,288, the 61.8% Fibonacci retracement level. Ripple price faces resistance at $0.500, its daily resistance level.
French Elections Preview: Euro to suffer after the calm, as specter of extremists, uncertainty rise Premium
![French Elections Preview: Euro to suffer after the calm, as specter of extremists, uncertainty rise](https://editorial.fxstreet.com/images/Macroeconomics/Countries/Europe/Eurozone_countries/France/pantheon-paris-with-french-flag-8748101_XtraSmall.jpg)
The first round of French parliamentary elections is set to trigger high uncertainty. Soothing messages from the far right and far left leave the Euro vulnerable to falls. Calm may return only after the second round of voting on July 7.