USD/JPY Price Analysis: Bulls climbing a wall of resistance
- USD/JPY is finding resistance in the 105.80s and focus is on the downside from monthly supply.
- On a break higher, bearish liquidity would be expected to firm.

USD/JPY has enjoyed a spell on the bid in a significant retracement of the monthly bearish trend.
However,the following is a top-down analysis that illustrates the mountain that the bulls still have to climb.
Monthly chart
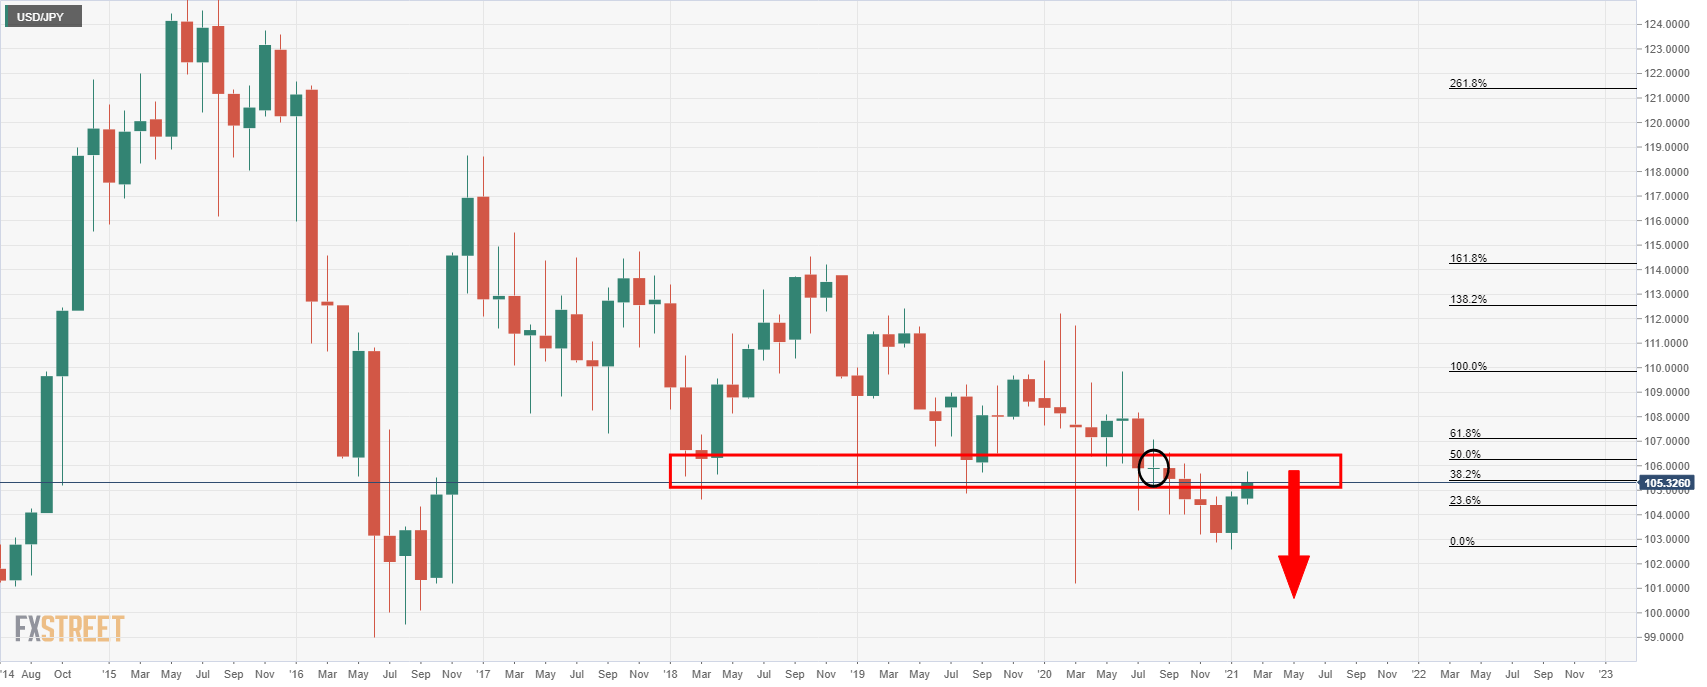
The monthly supply is compelling.
The eclipsed bullish candle in all of the prior bearish impulses would be expected to offer the strongest supply and liquidity within a 50% mean reversion and 38.2% Fibonacci retracement area of confluence between 105.40 and 106.20, with 105.80 as the mean.
Weekly chart
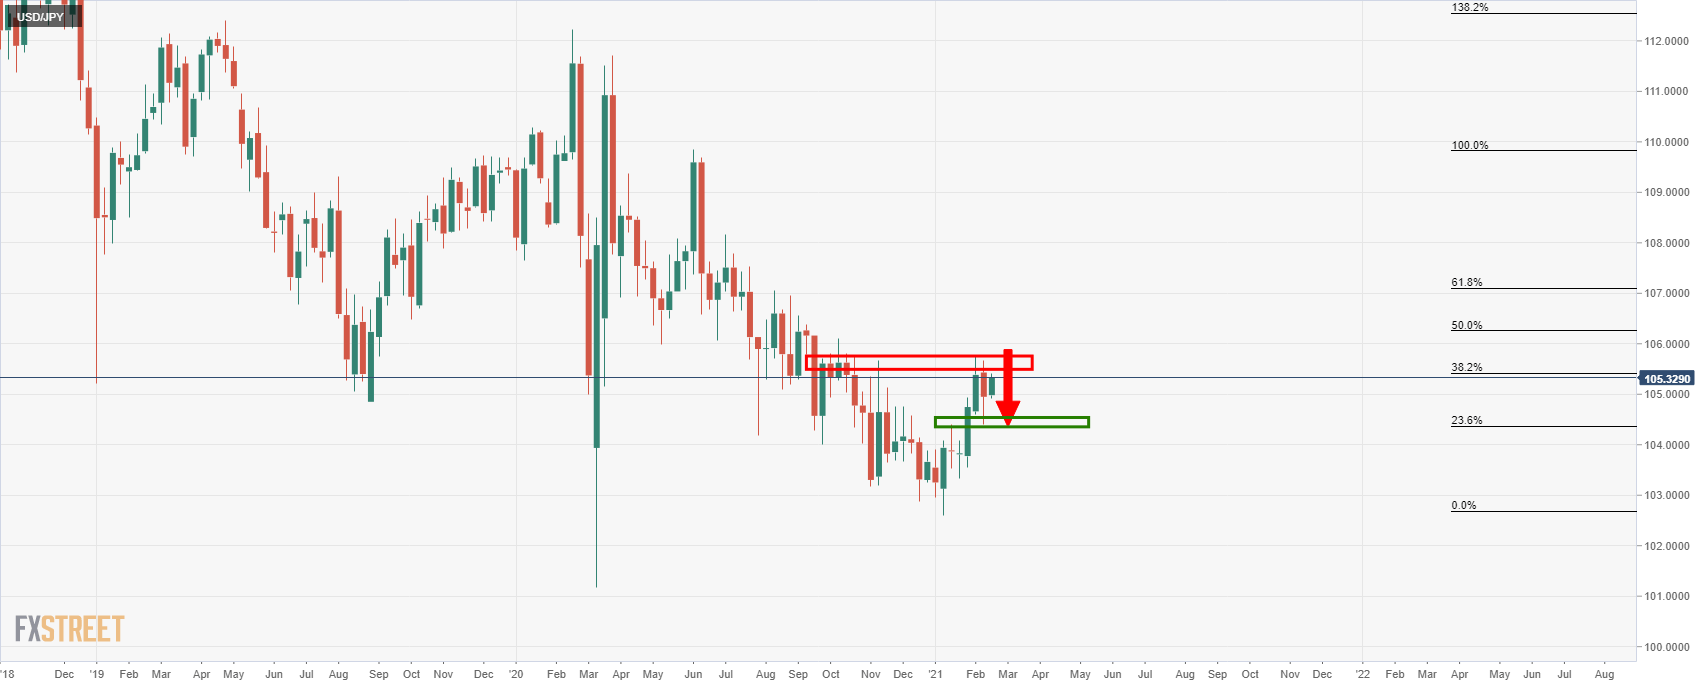
While the price is below resistance, the bias remains to the downside at this juncture from a weekly perspective.
Daily chart
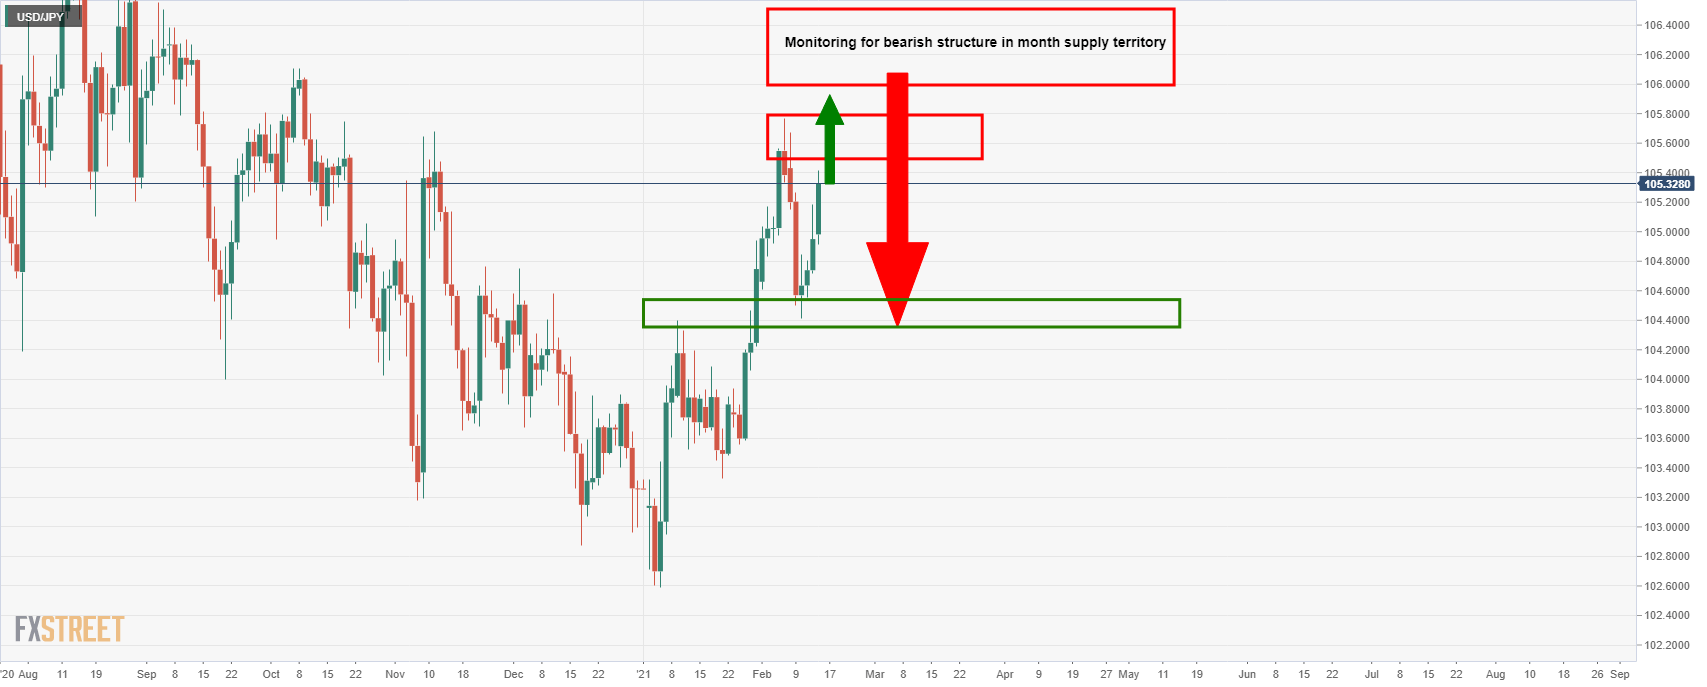
With the price testing resistance, there is the prospect of a higher high. In such an event, however, there would be expected to sellers from a positioning basis to meet the demand in the spot market.
Monthly supply territory would be expected to hold and result in a rejection of the next bullish impulse.
Author

Ross J Burland
FXStreet
Ross J Burland, born in England, UK, is a sportsman at heart. He played Rugby and Judo for his county, Kent and the South East of England Rugby team.


