• USD/JPY trades at 157.03, up 0.16%, driven by robust US employment figures.
  • Technical outlook shows bullish momentum with potential gains towards 158.00 and beyond.
  • Key support levels lie around 155.69/52 and 50-DMA at 155.11 if the pair dips below 156.00.

The USD/JPY jumped above the 157.00 figure on Monday, following last week’s stronger-than-expected employment data. Estimates that May’s inflation would likely remain high, with data pending to be released on Wednesday, ahead of the Federal Reserve’s monetary policy decision, drive the Greenback higher. The pair trades at 157.03, up 0.16%.

USD/JPY Price Analysis: Technical outlook

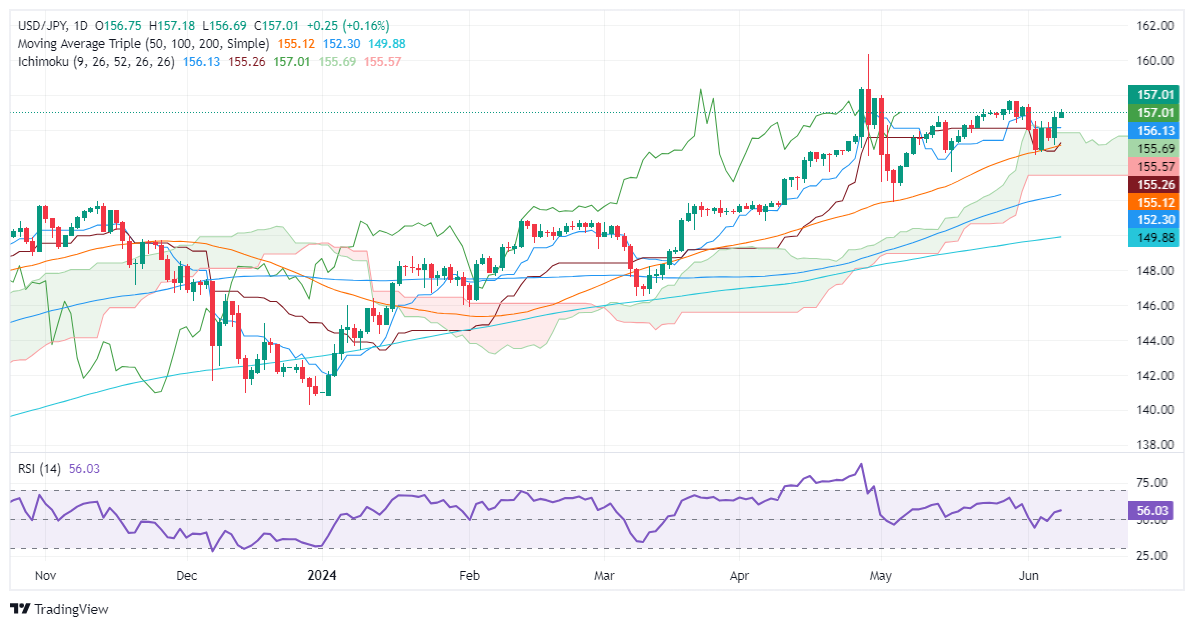
From a daily chart perspective, the USD/JPY remains consolidated with a slight upward tilt. The pair has climbed above the Ichimoku Cloud (Kumo), signaling buyers' strength. Momentum has turned bullish, but the pair may experience increased volatility due to potential intervention by Japanese authorities.

Should the USD/JPY clear the 157.00 figure, further gains lie ahead. Once cleared, the next stop would be 158.00. Further strength might see the pair reaching the April 26 high of 158.44 and then the year-to-date (YTD) high of 160.32.

Conversely, if the USD/JPY falls below 156.00, the first support level would be at the Senkou Span A and B confluence around 155.69/52, followed by the 50-day moving average (DMA) at 155.11. A breach of this level would expose the bottom of the Ichimoku Cloud (Kumo) around 153.40/50.

USD/JPY Price Action – Daily Chart

USD/JPY

Overview
Today last price 157.03
Today Daily Change 0.28
Today Daily Change % 0.18
Today daily open 156.75
 
Trends
Daily SMA20 156.35
Daily SMA50 155.01
Daily SMA100 152.21
Daily SMA200 149.83
 
Levels
Previous Daily High 157.07
Previous Daily Low 155.12
Previous Weekly High 157.47
Previous Weekly Low 154.55
Previous Monthly High 157.99
Previous Monthly Low 151.86
Daily Fibonacci 38.2% 156.33
Daily Fibonacci 61.8% 155.87
Daily Pivot Point S1 155.56
Daily Pivot Point S2 154.36
Daily Pivot Point S3 153.6
Daily Pivot Point R1 157.51
Daily Pivot Point R2 158.27
Daily Pivot Point R3 159.47


Share: Feed news

Information on these pages contains forward-looking statements that involve risks and uncertainties. Markets and instruments profiled on this page are for informational purposes only and should not in any way come across as a recommendation to buy or sell in these assets. You should do your own thorough research before making any investment decisions. FXStreet does not in any way guarantee that this information is free from mistakes, errors, or material misstatements. It also does not guarantee that this information is of a timely nature. Investing in Open Markets involves a great deal of risk, including the loss of all or a portion of your investment, as well as emotional distress. All risks, losses and costs associated with investing, including total loss of principal, are your responsibility. The views and opinions expressed in this article are those of the authors and do not necessarily reflect the official policy or position of FXStreet nor its advertisers. The author will not be held responsible for information that is found at the end of links posted on this page.

If not otherwise explicitly mentioned in the body of the article, at the time of writing, the author has no position in any stock mentioned in this article and no business relationship with any company mentioned. The author has not received compensation for writing this article, other than from FXStreet.

FXStreet and the author do not provide personalized recommendations. The author makes no representations as to the accuracy, completeness, or suitability of this information. FXStreet and the author will not be liable for any errors, omissions or any losses, injuries or damages arising from this information and its display or use. Errors and omissions excepted.

The author and FXStreet are not registered investment advisors and nothing in this article is intended to be investment advice.

Recommended content


Recommended content

Editors’ Picks

EUR/USD retreats to 1.0700 area following post-PCE jump

EUR/USD retreats to 1.0700 area following post-PCE jump

After spiking to a daily high of 1.0720 with the immediate reaction to US PCE inflation data, EUR/USD lost its traction and declined to the 1.0700 area. Investors remain cautious ahead of this weekend's French election and make it difficult for the Euro to gather strength.

EUR/USD News

GBP/USD stays below 1.2650 after US inflation data

GBP/USD stays below 1.2650 after US inflation data

GBP/USD struggles to preserve its bullish momentum and trades below 1.2650 in the American session on Friday. Earlier in the day, the data from the US showed that the annual core PCE inflation declined to 2.6% in May, limiting the USD's upside and helping the pair hold its ground.

GBP/USD News

Gold keeps its daily gains near $2,330 following US PCE data

Gold keeps its daily gains near $2,330 following US PCE data

Gold prices maintain their constructive bias around $2,330 after US inflation readings gauged by the PCE matched consensus in May and US yields advance slightly across the curve.

Gold News

BTC struggles around the $62,000 level

BTC struggles around the $62,000 level

Bitcoin price faces pullback resistance at the lower band of the descending wedge around $62,000. Ethereum price finds support at $3,288, the 61.8% Fibonacci retracement level. Ripple price faces resistance at $0.500, its daily resistance level.

Read more

French Elections Preview: Euro to suffer after the calm, as specter of extremists, uncertainty rise Premium

French Elections Preview: Euro to suffer after the calm, as specter of extremists, uncertainty rise

The first round of French parliamentary elections is set to trigger high uncertainty. Soothing messages from the far right and far left leave the Euro vulnerable to falls. Calm may return only after the second round of voting on  July 7.

Read more

Forex MAJORS

Cryptocurrencies

Signatures