|

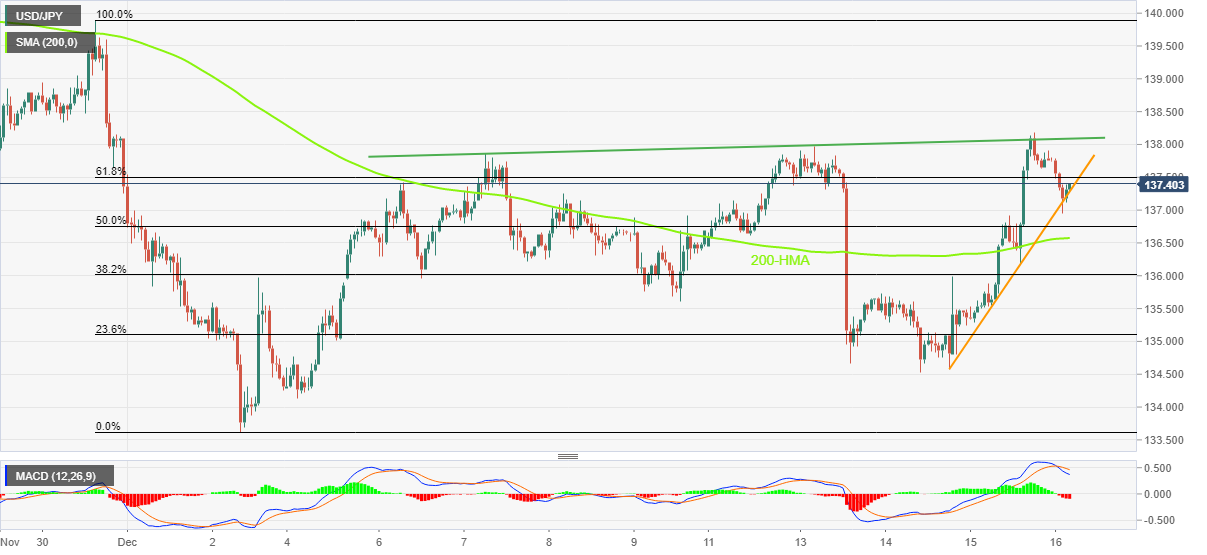
USD/JPY Price Analysis: Bounces off immediate support to pare intraday losses above 137.00

  • USD/JPY recovers from intraday low, bounces off three-day-old support line.
  • Bearish MACD signals, one-week-old ascending trend line challenge buyers.
  • 200-HMA, 134.50 act as the additional downside filters.

USD/JPY picks up bids to 137.40 as it pares intraday losses during early Friday morning in Europe. In doing so, the Yen pair bounces off an upward-sloping support line from Tuesday.

That said, the recovery moves currently aim for the ascending resistance line from December 07, close to 138.10. However, bearish MACD signals and the stated hurdle could challenge the pair’s further upside.

In a case where the USD/JPY pair stays firmer past 138.10, the 139.00 round figure and the November-end swing high near 139.90 could challenge the bulls.

It’s worth noting that the 140.00 round figure acts as the last defense of the pair bears.

Alternatively, a downside break of the aforementioned immediate support line, close to 137.25 by the press time, isn’t an open ticket to the USD/JPY bears as the 200-HMA support around 136.55 could challenge the quote’s further downside.

Following that, the weekly low around 134.50 may probe the USD/JPY bears before directing them to the monthly bottom around 133.60.

If at all the Yen pair remains bearish past 133.60, the odds of witnessing a south-run towards May’s high near 131.30 can’t be ruled out.

USD/JPY: Hourly chart

Trend: Limited recovery expected

Additional important levels

Overview
Today last price137.4
Today Daily Change-0.26
Today Daily Change %-0.19%
Today daily open137.66
 
Trends
Daily SMA20137.8
Daily SMA50142.71
Daily SMA100141.11
Daily SMA200135.47
 
Levels
Previous Daily High138.18
Previous Daily Low135.23
Previous Weekly High137.86
Previous Weekly Low134.13
Previous Monthly High148.82
Previous Monthly Low137.5
Daily Fibonacci 38.2%137.05
Daily Fibonacci 61.8%136.36
Daily Pivot Point S1135.87
Daily Pivot Point S2134.08
Daily Pivot Point S3132.92
Daily Pivot Point R1138.81
Daily Pivot Point R2139.97
Daily Pivot Point R3141.76

Author

Anil Panchal

Anil Panchal

FXStreet

Anil Panchal has nearly 15 years of experience in tracking financial markets. With a keen interest in macroeconomics, Anil aptly tracks global news/updates and stays well-informed about the global financial moves and their implications.

More from Anil Panchal
Share:

Editor's Picks

EUR/USD extends losses toward 1.1600 ahead of EU inflation data

EUR/USD extends the decline toward 1.1600 in the European session on Tuesday. The pair remains under pressure as surging energy prices amid the US-Iran war have increased the risks of higher inflation for the Old Continent. The focus is now on the Eurozone preliminary inflation reading for February. 

GBP/USD drops back toward three-month lows below 1.3350

GBP/USD is back in the red, accelerating its downside toward the three-month lows of 1.3315 in European trading on Tuesday. The ongoing escalation in the Iran war, combined with rising Oil prices, weighs negatively on the higher-yielding Pound Sterling as the US Dollar preserves the previous upside. 

Gold weakens below $5,300 as sustained USD buying counter Middle East tensions

Gold attracts some intraday selling and falls around $100 from the daily top, around the $5,380 area. The US Dollar climbs to a fresh high since January 20 and turns  out to be a key factor exerting downward pressure on the commodity. However, concerns about a broader regional conflict in the Middle East continue to weigh on investors' sentiment and underpin demand for the traditional safe-haven bullion.

Stellar risks deeper losses as derivatives metrics turn negative

Stellar is trading red below $0.16 at the time of writing on Tuesday, after a slight recovery the previous day. Weakening derivatives data caps the recovery, while an unfavorable technical outlook projects a deeper correction for the XLM token in the upcoming days.

The market is not panicking it is repricing the probability distribution of Oil and time

At the end of the day, markets do not trade morality or geopolitics. They trade transmission channels. And the only channel that truly matters in this maelstrom runs through the price of energy and the time value of money.

Hyperliquid Price Forecast: HYPE rises on commodities demand amid US-Iran war

Hyperliquid (HYPE) steadies above $33 at press time on Tuesday, marking its fourth consecutive day of recovery in a broadly volatile market due to the ongoing US-Israel strikes on Iran.