- USD/JPY has continued its 12-day winning streak after surpassing 150.30.
- An ultra-loose monetary policy is responsible for the sheer destruction of the Japanese yen.
- The absence of divergence and momentum loss indicates that the upside is intact.
The USD/JPY pair continued its 12-day winning streak on Friday by overstepping Thursday’s high at 150.29. The asset is not reacting to any rebound in the risk-on impulse but is capitalizing negative market sentiment period effectively. Ultra-loose monetary policy is responsible for the sheer destruction of the Japanese yen.
The US dollar index (DXY) is gathering interest for stabilization above the critical hurdle of 113.00. While the returns on US government bonds are soaring like there is no tomorrow. The 10-year US Treasuring yields are continuously refreshing their 14-year highs. At the time of writing, 10-year yields stand at 4.26%.
Monthly chart
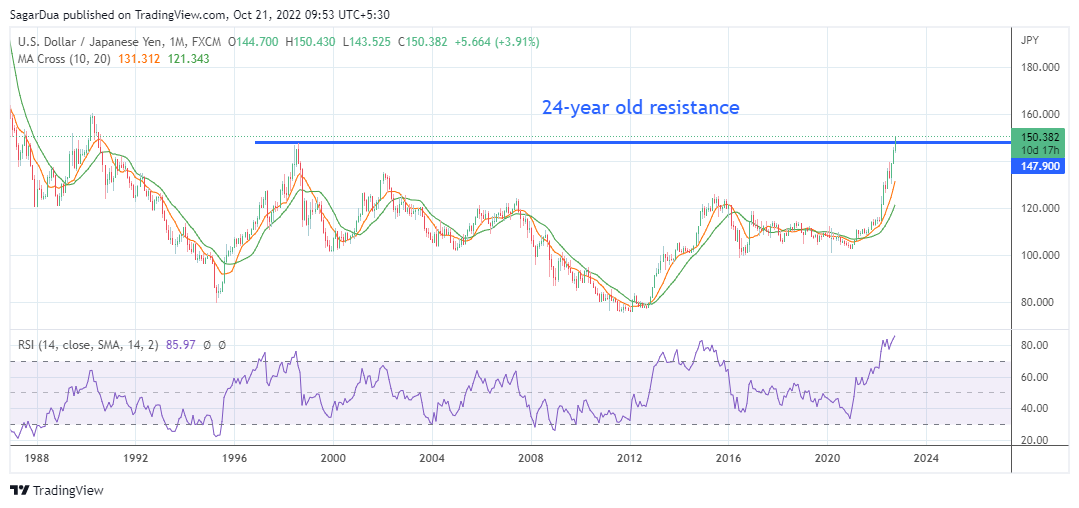
An upside break of the 24-year-old resistance at 147.67 has infused adrenaline rush into the greenback bulls. The 10-and 20-period Exponential Moving Averages (EMAs) at 131.31 and 121.34 respectively are advancing, which indicates more upside ahead.
The Relative Strength Index (RSI) (14) has printed a high near 86.00. There is no denying the fact that the momentum oscillator is showing overbought signals. However, the absence of divergence signals and momentum loss is not favoring any correction yet.
Daily chart
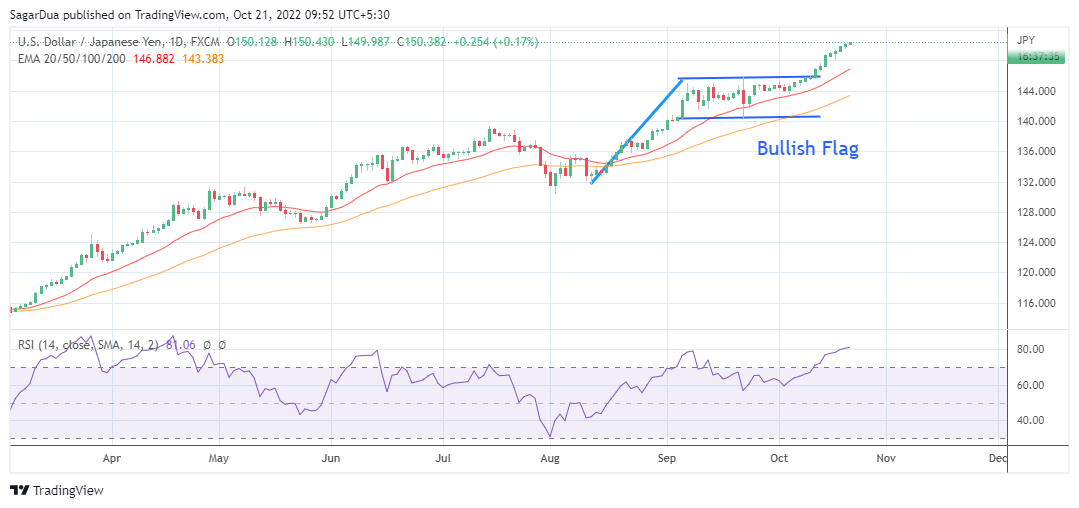
On a daily scale, the asset has delivered a perpendicular upside move after a breakout of the Bullish Flag. The chart pattern indicates an upside break of the mark-up inventory adjustment. Advancing 20-and 50-period EMAs at 146.68 and 143.38 respectively adds to the upside filters.
Also, the RSI (14) has crossed 80.00, showing no signs of divergence but an overbought situation cannot be ruled out.
A mild correction towards the psychological support of 150.00 will present a bargain buy for investors, which will drive the asset towards a fresh 32-year high at 150.43, followed by July 1990 high at 152.25.
On the flip side, the asset could trigger reversal if it drops below Monday’s low of 148.11, which will drag the asset towards the October 13 high at 147.67. A slippage below the latter will further drop the major to October 13 low at 146.42.
Information on these pages contains forward-looking statements that involve risks and uncertainties. Markets and instruments profiled on this page are for informational purposes only and should not in any way come across as a recommendation to buy or sell in these assets. You should do your own thorough research before making any investment decisions. FXStreet does not in any way guarantee that this information is free from mistakes, errors, or material misstatements. It also does not guarantee that this information is of a timely nature. Investing in Open Markets involves a great deal of risk, including the loss of all or a portion of your investment, as well as emotional distress. All risks, losses and costs associated with investing, including total loss of principal, are your responsibility. The views and opinions expressed in this article are those of the authors and do not necessarily reflect the official policy or position of FXStreet nor its advertisers. The author will not be held responsible for information that is found at the end of links posted on this page.
If not otherwise explicitly mentioned in the body of the article, at the time of writing, the author has no position in any stock mentioned in this article and no business relationship with any company mentioned. The author has not received compensation for writing this article, other than from FXStreet.
FXStreet and the author do not provide personalized recommendations. The author makes no representations as to the accuracy, completeness, or suitability of this information. FXStreet and the author will not be liable for any errors, omissions or any losses, injuries or damages arising from this information and its display or use. Errors and omissions excepted.
The author and FXStreet are not registered investment advisors and nothing in this article is intended to be investment advice.


Recommended content
Editors’ Picks

EUR/USD bounces off lows, retests 1.1370
Following an early drop to the vicinity of 1.1310, EUR/USD now manages to regain pace and retargets the 1.1370-1.1380 band on the back of a tepid knee-jerk in the US Dollar, always amid growing optimism over a potential de-escalation in the US-China trade war.

GBP/USD trades slightly on the defensive in the low-1.3300s
GBP/USD remains under a mild selling pressure just above 1.3300 on Friday, despite firmer-than-expected UK Retail Sales. The pair is weighed down by a renewed buying interest in the Greenback, bolstered by fresh headlines suggesting a softening in the rhetoric surrounding the US-China trade conflict.

Gold remains offered below $3,300
Gold reversed Thursday’s rebound and slipped toward the $3,260 area per troy ounce at the end of the week in response to further improvement in the market sentiment, which was in turn underpinned by hopes of positive developments around the US-China trade crisis.

Ethereum: Accumulation addresses grab 1.11 million ETH as bullish momentum rises
Ethereum saw a 1% decline on Friday as sellers dominated exchange activity in the past 24 hours. Despite the recent selling, increased inflows into accumulation addresses and declining net taker volume show a gradual return of bullish momentum.

Week ahead: US GDP, inflation and jobs in focus amid tariff mess – BoJ meets
Barrage of US data to shed light on US economy as tariff war heats up. GDP, PCE inflation and nonfarm payrolls reports to headline the week. Bank of Japan to hold rates but may downgrade growth outlook. Eurozone and Australian CPI also on the agenda, Canadians go to the polls.

The Best brokers to trade EUR/USD
SPONSORED Discover the top brokers for trading EUR/USD in 2025. Our list features brokers with competitive spreads, fast execution, and powerful platforms. Whether you're a beginner or an expert, find the right partner to navigate the dynamic Forex market.