- USD/JPY retreats from one-week high to snap three-day uptrend.
- Downside break of weekly support line adds strength to bearish bias.
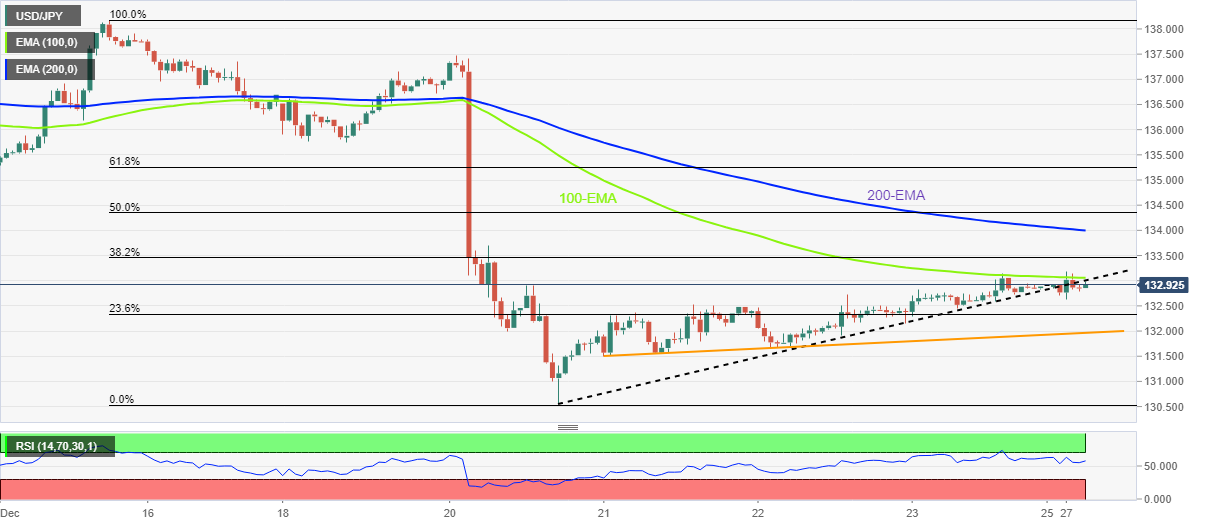
- 100, 200 EMAs add to the upside filters.
USD/JPY remains depressed around 132.90 as it prints the first daily loss in four during early Tuesday morning in Europe. In doing so, the Yen pair justifies the downside break of a one-wee-old ascending trend line, as well as a U-turn from the 100-hour Exponential Moving Average (EMA).
The pullback move also takes clues from the RSI (14) retreat, as well as an absence of the oversold RSI line.
That said, the USD/JPY price aim for the 23.6% Fibonacci retracement level of December 15-20 downside, near 132.30.
Following that, an upward-sloping support line from the last Wednesday, near the 132.00 round figure could test the USD/JPY bears before directing them to the recently flashed multi-month low near 130.60.
In a case where the USD/JPY pair drops below 130.60, the August 2022 low near 130.40 and the 130.00 psychological magnet could act as the last defense of the buyers.
Alternatively, the support-turned-resistance line and the 100-EMA, respectively around 132.95 and 133.05, could restrict immediate USD/JPY recovery before highlighting the 200-EMA level of 134.00.
Should the USD/JPY bulls keep the reins past 134.00, the December 19 swing low near 135.80 will gain the market’s attention.
It should be noted that the 50% and 61.8% Fibonacci retracement levels, respectively near 134.35 and 135.25, could probe the USD/JPY bulls during the expected rise.
USD/JPY: Hourly chart
Trend: Further downside expected
Information on these pages contains forward-looking statements that involve risks and uncertainties. Markets and instruments profiled on this page are for informational purposes only and should not in any way come across as a recommendation to buy or sell in these assets. You should do your own thorough research before making any investment decisions. FXStreet does not in any way guarantee that this information is free from mistakes, errors, or material misstatements. It also does not guarantee that this information is of a timely nature. Investing in Open Markets involves a great deal of risk, including the loss of all or a portion of your investment, as well as emotional distress. All risks, losses and costs associated with investing, including total loss of principal, are your responsibility. The views and opinions expressed in this article are those of the authors and do not necessarily reflect the official policy or position of FXStreet nor its advertisers. The author will not be held responsible for information that is found at the end of links posted on this page.
If not otherwise explicitly mentioned in the body of the article, at the time of writing, the author has no position in any stock mentioned in this article and no business relationship with any company mentioned. The author has not received compensation for writing this article, other than from FXStreet.
FXStreet and the author do not provide personalized recommendations. The author makes no representations as to the accuracy, completeness, or suitability of this information. FXStreet and the author will not be liable for any errors, omissions or any losses, injuries or damages arising from this information and its display or use. Errors and omissions excepted.
The author and FXStreet are not registered investment advisors and nothing in this article is intended to be investment advice.


Recommended content
Editors’ Picks

Gold falls amid a possible de-escalation of US-China tensions Premium
Gold pulled back from its all-time high of $3,500 per troy ounce reached earlier on Tuesday, as a resurgent US Dollar and signs of easing tensions in the US–China trade dispute appeared to draw sellers back into the market.

EUR/USD retreats to daily lows near 1.1440
EUR/USD loses the grip and retreats to the 1.1440 zone as the Greenback’s rebound now gathers extra steam, particulalry after some positive headlines pointing to mitigating trade concerns on the US-China front on Tuesday.

GBP/USD deflates to weekly lows near 1.3350
GBP/USD loses further momentum and recedes to the 1.3350 zone on Tuesday, or two-day troughs, all in response to the frmer tone in the US Dollar and encouraging news from the US-China trade scenario.

3% of Bitcoin supply in control of firms with BTC on balance sheets: The good, bad and ugly
Bitcoin disappointed traders with lackluster performance in 2025, hitting the $100,000 milestone and consolidating under the milestone thereafter. Bitcoin rallied past $88,000 early on Monday, the dominant token eyes the $90,000 level.

Five fundamentals for the week: Traders confront the trade war, important surveys, key Fed speech Premium
Will the US strike a trade deal with Japan? That would be positive progress. However, recent developments are not that positive, and there's only one certainty: headlines will dominate markets. Fresh US economic data is also of interest.

The Best brokers to trade EUR/USD
SPONSORED Discover the top brokers for trading EUR/USD in 2025. Our list features brokers with competitive spreads, fast execution, and powerful platforms. Whether you're a beginner or an expert, find the right partner to navigate the dynamic Forex market.