USD/JPY Price Analysis: Bears are lurking and a significant correction could be on the cards
- USD/JPY bears could be about to move in and cap the rally.
- A drop below 136.57 could be the catalyst for a near term run to 136.10 and beyond.

With the divergence between the Bank of Japan and the Federal Reserve, the yen has been crushed to multi-year levels and the following illustrates the prospects of a move even lower according to the monthly structure:
USD/JPY monthly chart
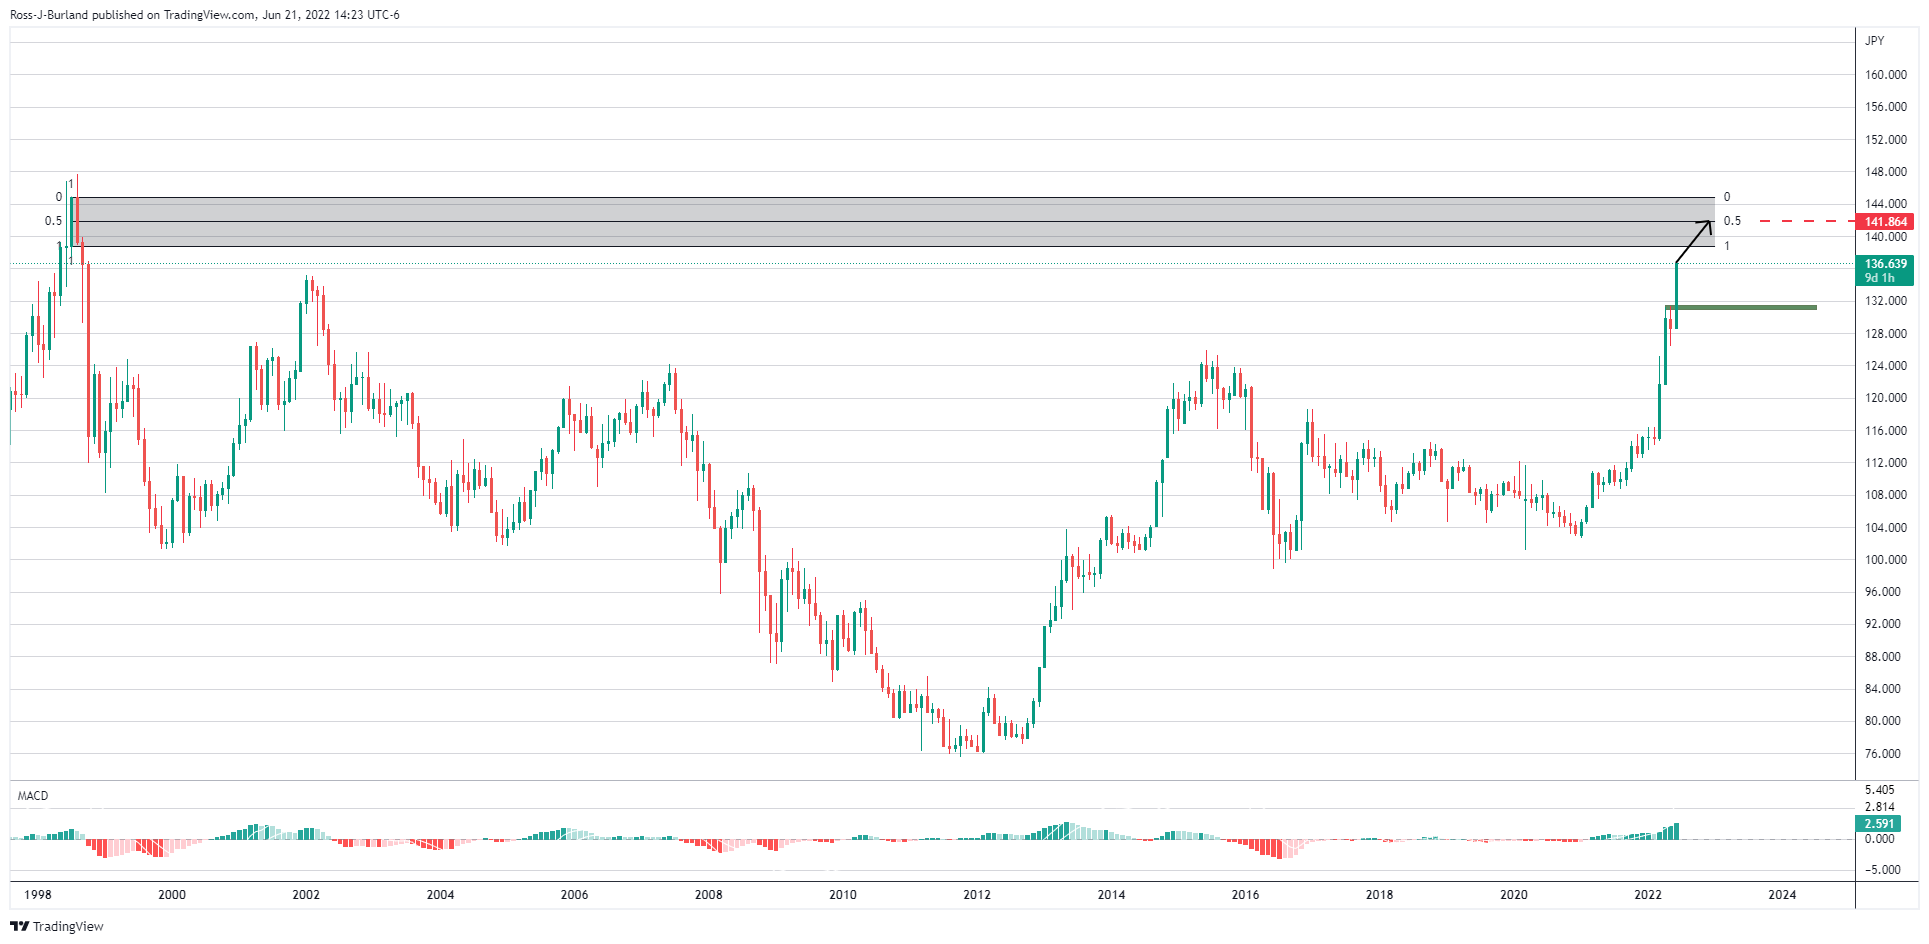
As illustrated, the price is reaching for blue skies as it clears 2002 levels and eyes the body of the monthly reversal candle from August 1998. The mid point of that candle is as high as 141.86.
USD/JPY weekly chart
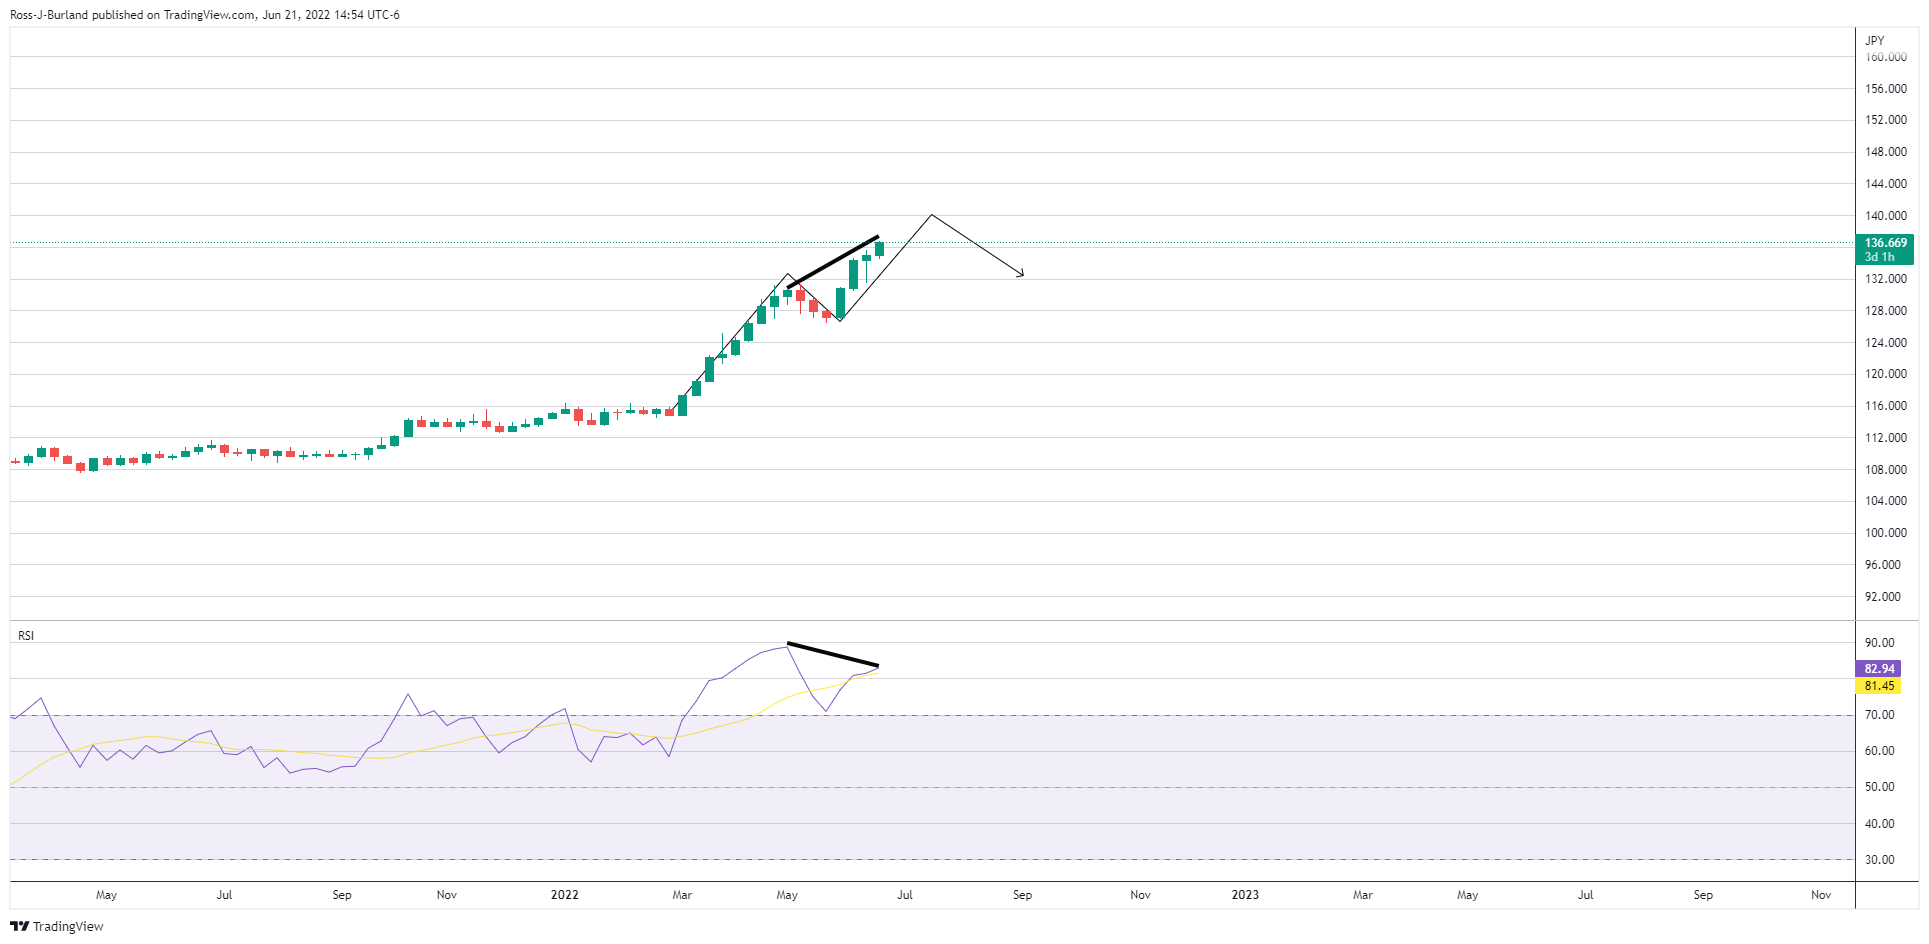
However, RSI bearish divergence is playing out on the lower time frames, such as the above weekly chart and below on the daily chart.
A bearish correction could be on the cards:
USD/JPY daily chart
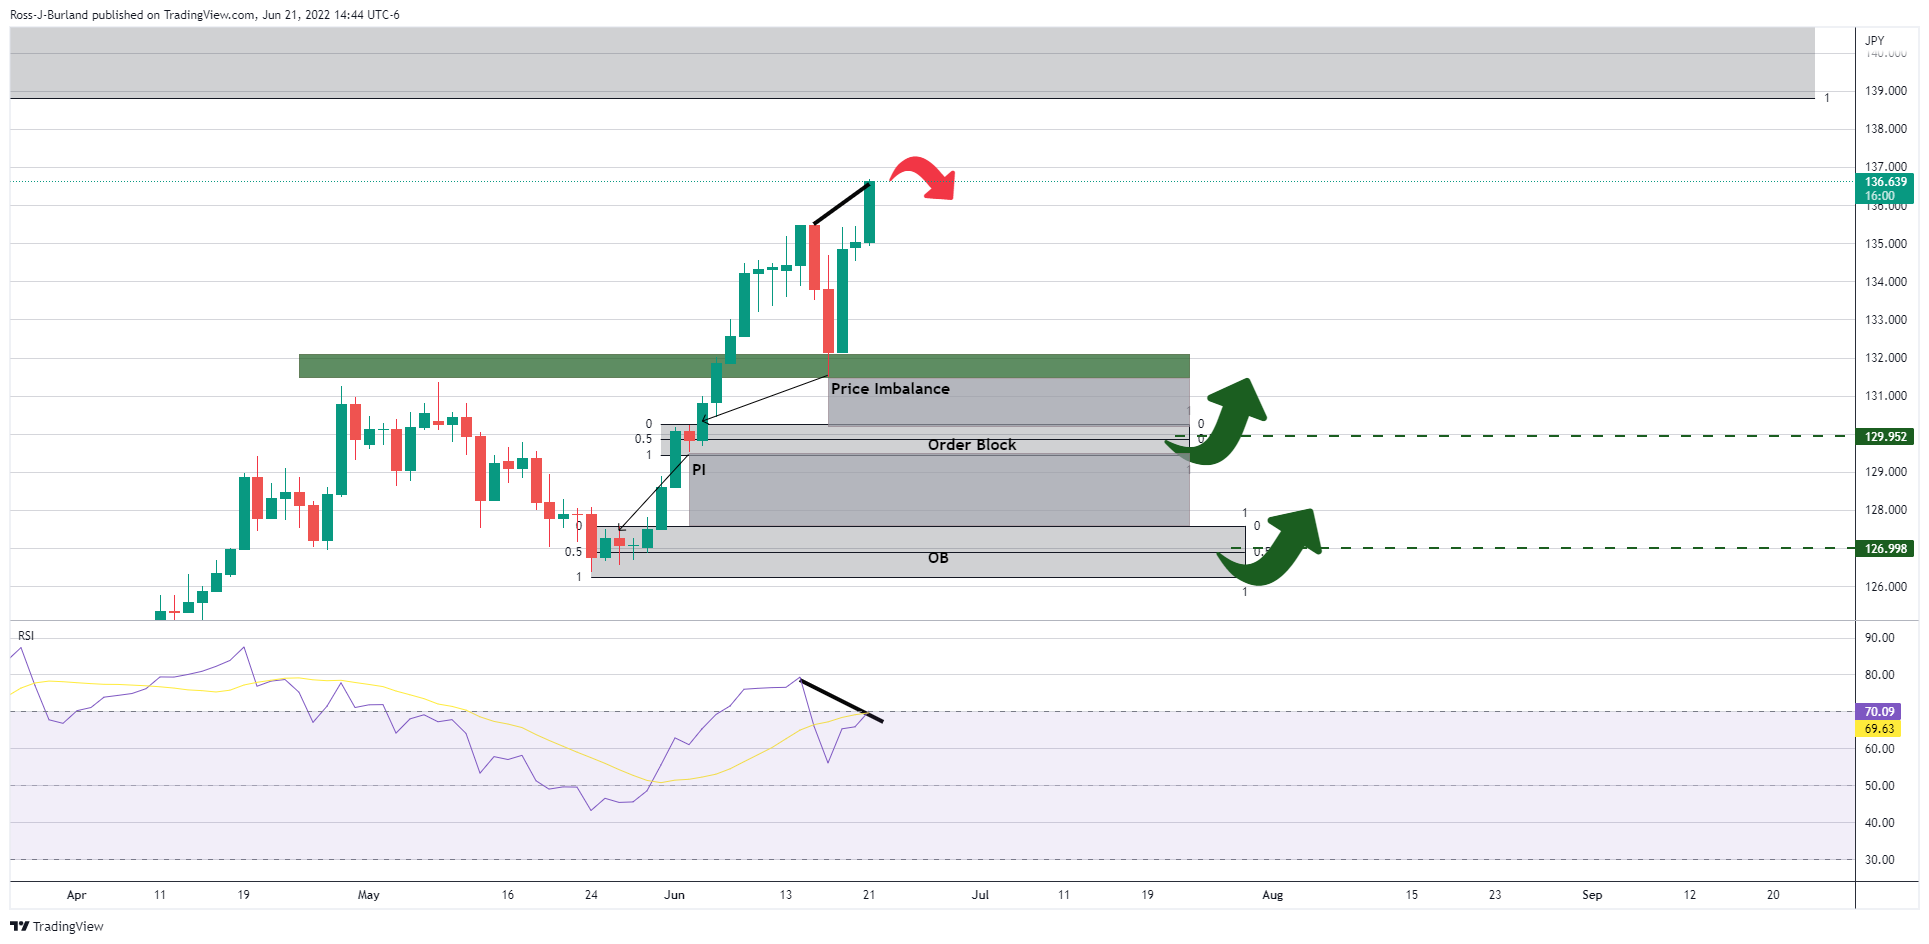
From a daily perspective, the prior lows near 131.50, if broken, will open the risk of a test below 130.00 and 127.00 thereafter, both of which are levels of liquidity and below areas of an imbalance in price.
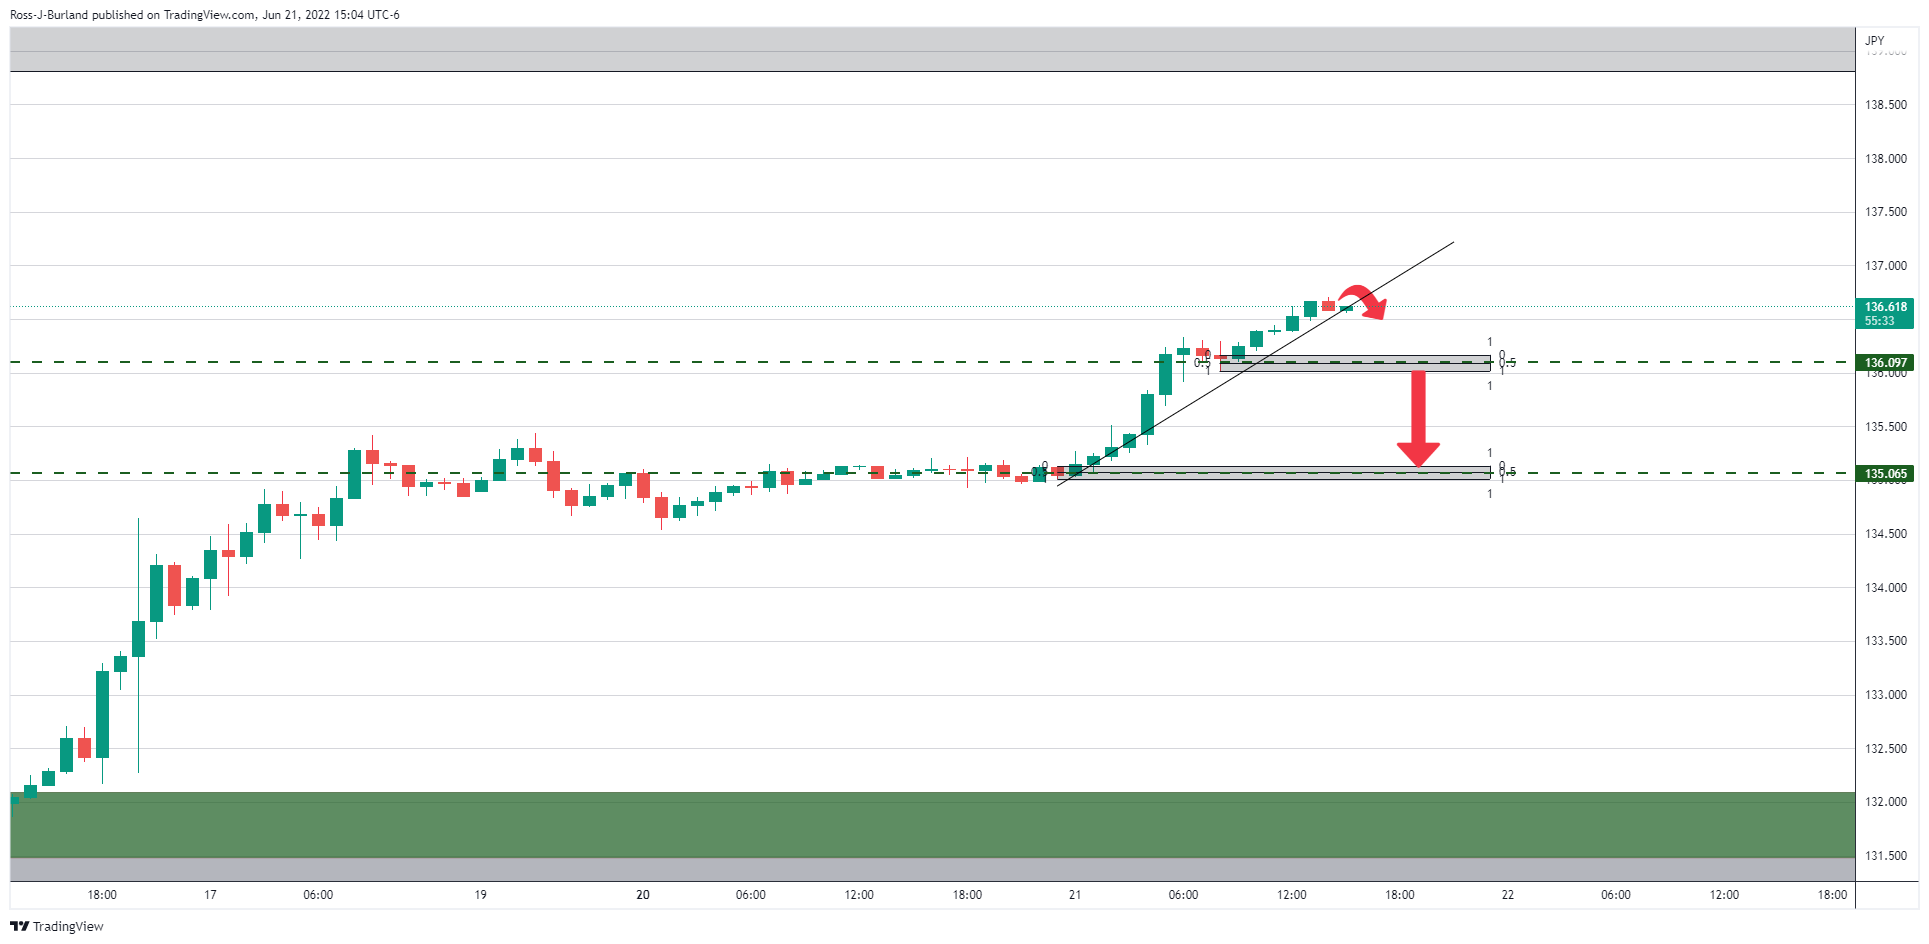
From an hourly perspective, the price is starting to round off. The significant downside prospects will kick in on a break of 136.00 and 135.06 respectively as midpoints of hourly order blocks.
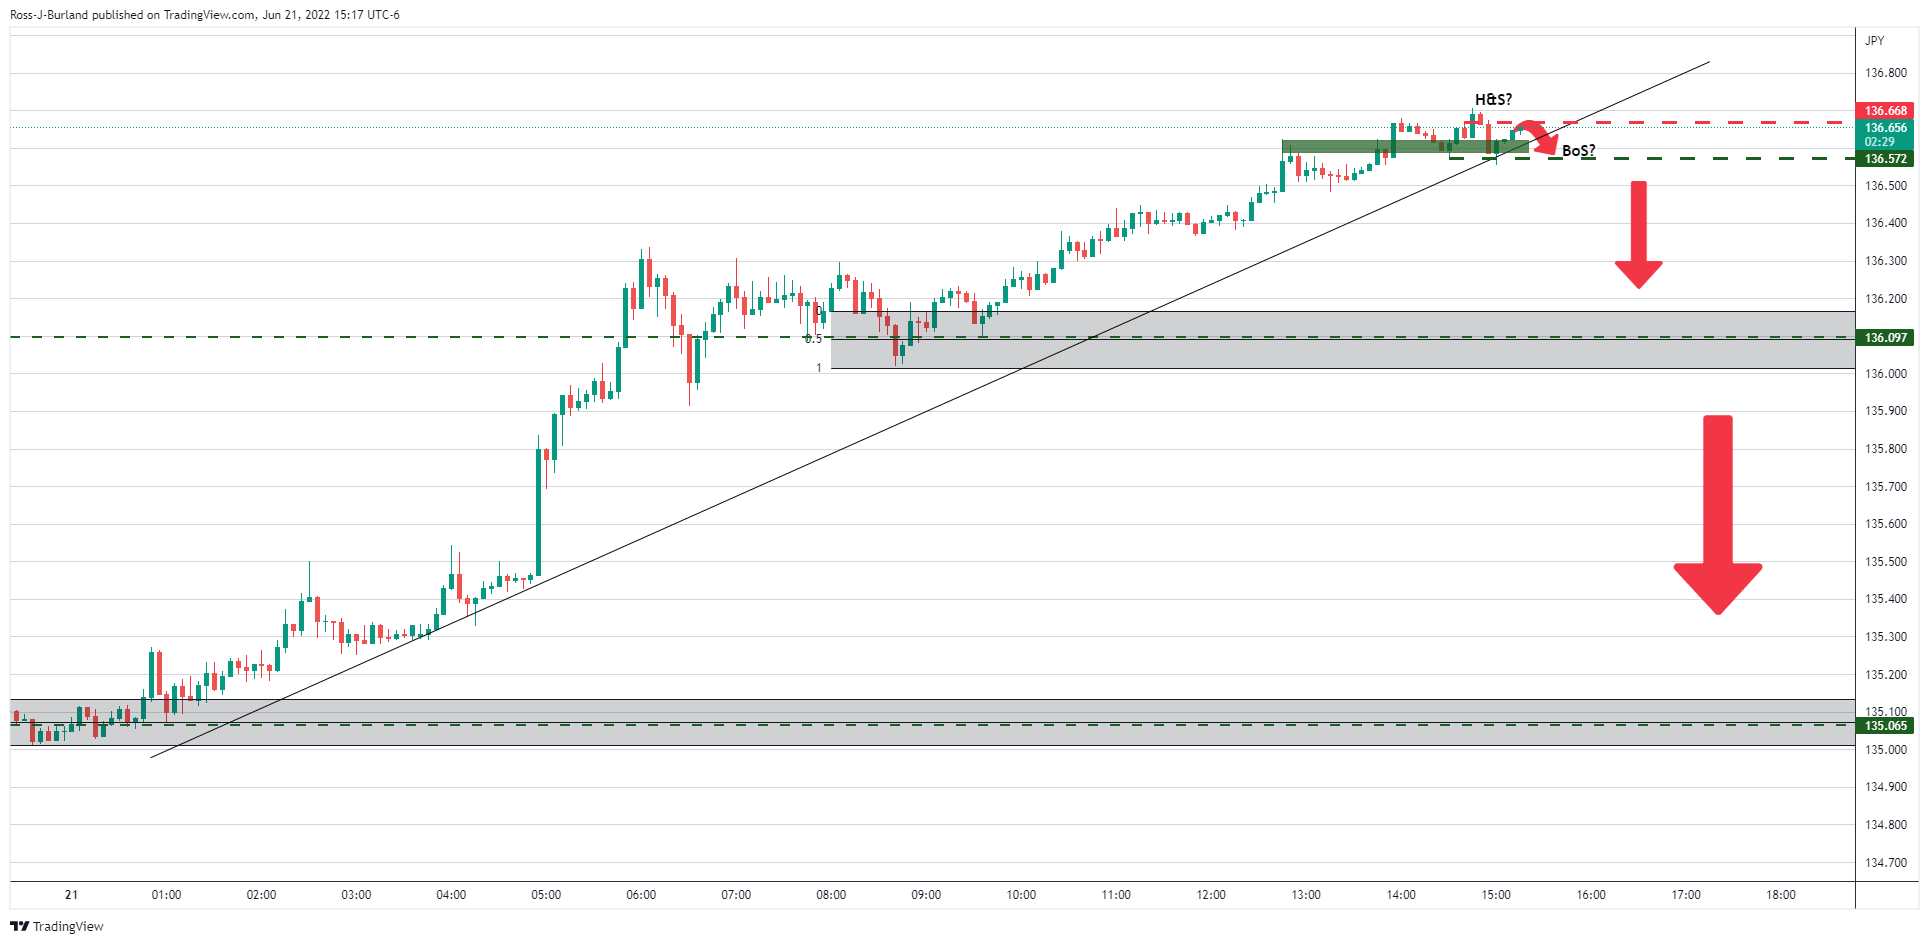
From a 5-min chart's perspective, the price could be on the verge of a break of structure (BoS) of 136.57, resulting in a bearish head and shoulders (H&S) and a significant move to the downside as per the hourly levels identified.
Author

Ross J Burland
FXStreet
Ross J Burland, born in England, UK, is a sportsman at heart. He played Rugby and Judo for his county, Kent and the South East of England Rugby team.


