|

USD/JPY Price Analysis: Battles at the 20-day EMA around 131.40, retreats below 128.60

  • USD/JPY trims some of its Asian session gains courtesy of the Bank of Japan’s decision.
  • USD/JPY Price Analysis: Failure to conquer the 20-day EMA exacerbated a 200-plus pip fall beneath 128.50.

The USD/JPY clings to gains after hitting a daily high of 131.57 following the release of the Bank of Japan’s (BoJ) monetary policy decision, which sparked a 400 pip rally. However, throughout the North American session, the Japanese Yen (JPY) stages a comeback against its counterpart, the US Dollar (USD), and so far is down 0.24%. At the time of writing, the USD/JPY is trading at 128.56.

USD/JPY Price Analysis: Technical outlook

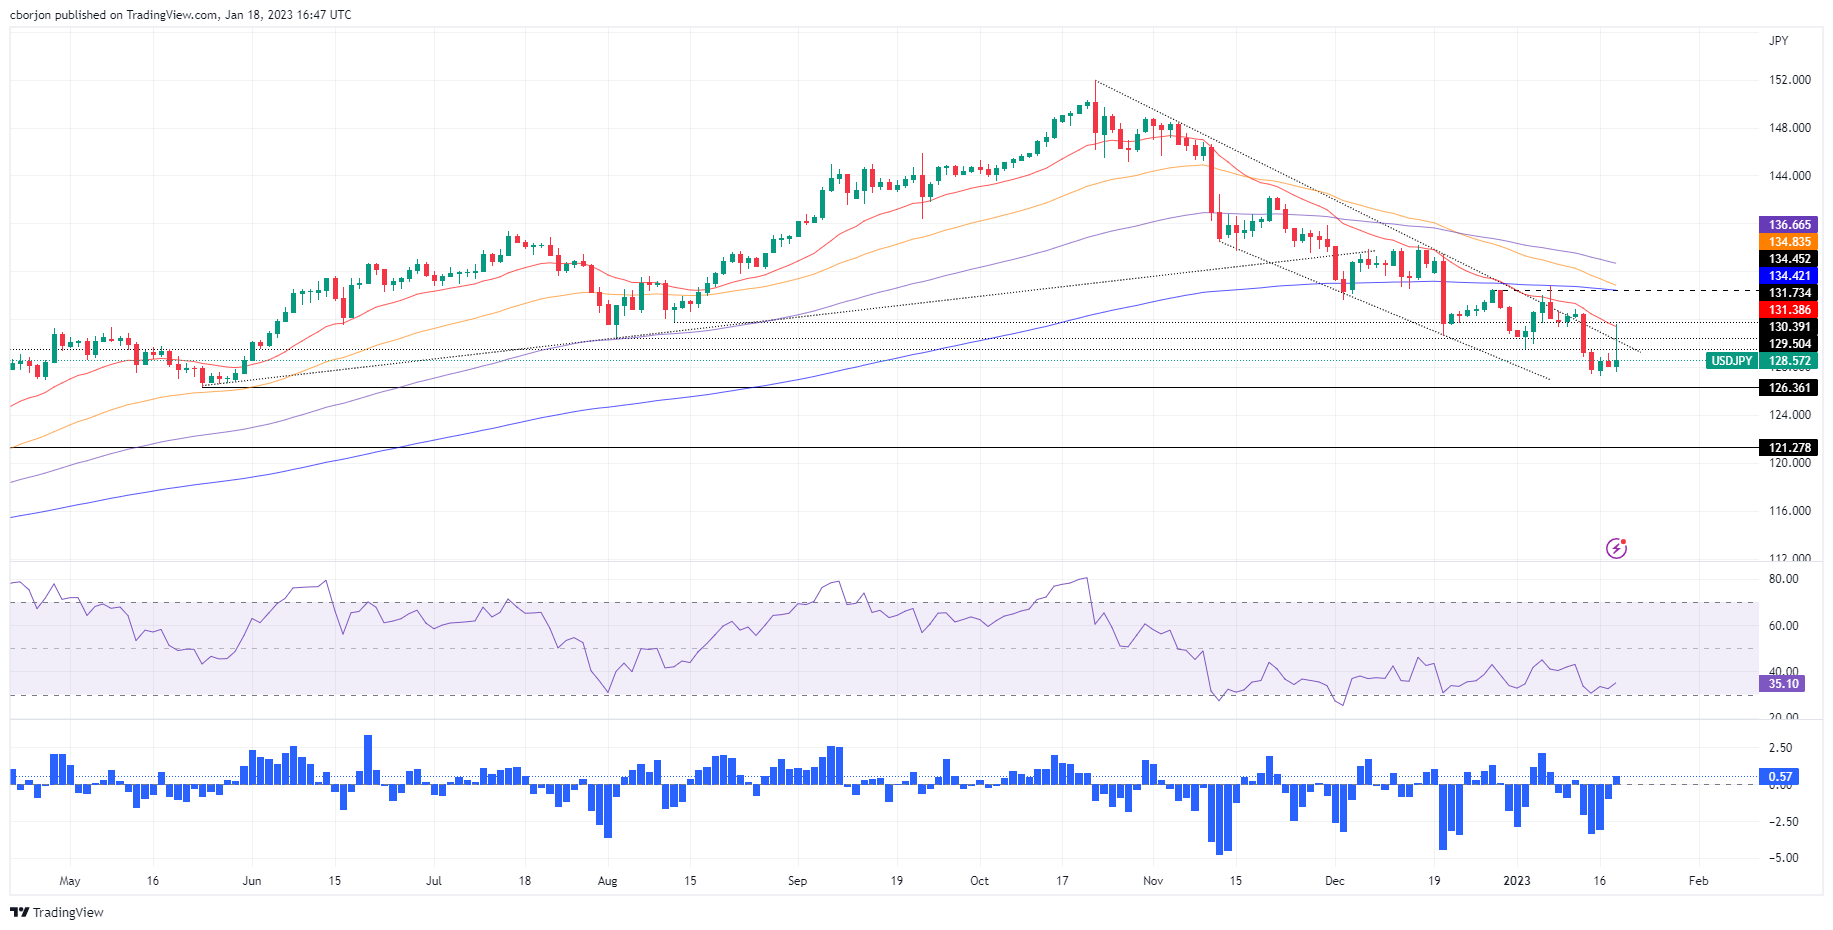
The USD/JPY daily chart portrays the major tested the confluence of the 20-day Exponential Moving Average (EMA) and the day’s high at 131.37 and failed to sustain the uptrend. Furthermore, on its way down, the USD/JPY retraced below a four-month downslope resistance trendline that passed around 130.30 ad extended its downtrend beneath 129.00 toward the current spot price.

However, oscillators like the Relative Strength Index (RSI although at bearish territory, its slope aims up, which could mean a reversal could happen. But the Rate of Change (Roc) suggests buyers are losing momentum as it retraces to the zero level.

The path of least resistance in the USD/JPY is downward biased, though if the USD/JPY prints a daily close above 128.46, that could open the door for further upside and might test the 129.00 mark. Otherwise, the USD/JPY first support would be 128.00. A breach of the latter will expose the May 24 swing low of 126.36, followed by the March 31 daily low of  121.27.

USD/JPY Key Technical Levels

USD/JPY

Overview
Today last price128.6
Today Daily Change0.39
Today Daily Change %0.30
Today daily open128.21
 
Trends
Daily SMA20131.65
Daily SMA50135.59
Daily SMA100140.42
Daily SMA200136.67
 
Levels
Previous Daily High129.16
Previous Daily Low127.99
Previous Weekly High132.87
Previous Weekly Low127.46
Previous Monthly High138.18
Previous Monthly Low130.57
Daily Fibonacci 38.2%128.44
Daily Fibonacci 61.8%128.72
Daily Pivot Point S1127.75
Daily Pivot Point S2127.28
Daily Pivot Point S3126.58
Daily Pivot Point R1128.92
Daily Pivot Point R2129.63
Daily Pivot Point R3130.09

Author

Christian Borjon Valencia

Markets analyst, news editor, and trading instructor with over 14 years of experience across FX, commodities, US equity indices, and global macro markets.

More from Christian Borjon Valencia
Share:

Editor's Picks

EUR/USD looks to stabilize near 1.1600 as focus shifts to US data

EUR/USD is looking to stabilize near 1.1600 in the European session on Wednesday as traders breathe a sigh of relief before the top-tier US ADP jobs and ISM Services PMI data. A pause in the US Dollar uptrend helps the pair's recovery, but surging energy prices due to the Iran war will likely remain a drag. 

GBP/USD stays weak near 1.3350 as USD preserves gains

GBP/USD stays in the red below 1.3350 in the European session on Wednesday. Escalating conflict in the Middle East keeps the "flight to safety" theme intact, supporting the US Dollar against the Pound Sterling. Traders will take more cues from the US ADP Employment and ISM Services Purchasing Managers Index reports, which are due later on Wednesday. 

Gold retains positive bias amid sustained safe-haven flows and modest USD pullback

Gold maintains its offered tone through the first half of the European session, though it lacks follow-through and remains below the $5,200 mark. Investors remain concerned about a prolonged conflict in the Middle East and its impact on the global economy amid an already uncertain environment.

Bitcoin, Ethereum and Ripple struggle for direction as consolidation persists

Bitcoin, Ethereum and Ripple prices trade with a cautious tone at the time of writing on Wednesday as upside momentum continues to fade across the broader crypto market. BTC remains within a parallel channel, ETH struggles below key resistance, while XRP remains fragile within a descending channel. These top three cryptocurrencies by market capitalization continue to struggle to establish a directional bias amid the consolidation phase.

Asian stocks fall as South Korea’s KOSPI slumps over 10%

Asian equities drop on Middle East tensions; the MSCI Asia Pacific Index falls up to 4%. South Korea’s KOSPI fell 10.71% near 5,170, with the Korean Won weakened past 1,500 per dollar.

Solana Price Forecast: SOL consolidation near resistance as ETF inflows offer mild support

Solana price is facing slight rejection as it approaches the upper boundary of the consolidation range at around $88 on Wednesday. Institutional demand is strengthening as spot Exchange Traded Funds recorded two consecutive inflows so far this week.