- The Indian Rupee edges higher in Tuesday’s early European session.
- India’s FM Nirmala Sitharaman presented Budget with a focus on taxes and jobs.
- Persistent foreign inflows to India and lower crude oil prices might support the INR in the near term.
- Investors await the US Existing Home Sales and Richmond Fed Manufacturing Index later on Tuesday.
The Indian Rupee (INR) recovers some lost ground on Tuesday after falling to an all-time low in the previous session. India’s Finance Minister Nirmala Sitharaman presented her seventh consecutive Union Budget 2024-25 on Tuesday at the Budget Session of Parliament. The INR edges higher as markets expect the Union Budget 2024 could help boost consumption in the economy. Additionally, strong inflows into the Indian equity markets and a decline in crude oil prices might underpin the INR in the near term.
Nonetheless, a weak Chinese Yuan, and sustained US Dollar (USD) demand from local corporates and oil companies might continue to undermine the INR. The downside of the Indian Rupee might be limited as the Reserve Bank of India (RBI) is likely to intervene to support the local currency against depreciation.
Market players will keep an eye on the US Existing Home Sales and Richmond Fed Manufacturing Index on Tuesday. Later this week, the attention will shift to the preliminary US S&P Global Purchasing Managers Index (PMI) for July, Gross Domestic Product (GDP) for the second quarter and the Personal Consumption Expenditures Price Index (PCE) data for June, which will be released on Wednesday, Thursday and Friday, respectively.
Daily Digest Market Movers: Indian Rupee rebounds after India’s Union Budget
- Finance Minister Nirmala Sitharaman said at the Budget Session of Parliament on Tuesday that inflation continues to be slow and stable amid significant downside risks to growth and upside risks to inflation.
- The Finance Minister announced a provision of 1.52 trillion Rupees for agriculture and allied sectors and a provision of 2.66 trillion Rupees for rural development.
- The Indian government will also allocate 2 trillion rupees ($24 billion) for job creation over the next five years and will provide incentives to both employees and employers in the manufacturing sector.
- The Finance Minister stated that under PM Awas Yojana, Urban 2.0, the housing needs of the urban poor and middle class will be addressed with an investment of Rs 10 lakh crore.
- The Indian government will promote the Indian Rupee for overseas investments, noting that the rules and regulations for EDI will be simplified.
- The Government will reduce customs duty on gold, and silver to 6%, and platinum to 6.4%, said Nirmala Sitharaman.
- The Finance Minister stated that long-term capital gains on all financial and non-financial assets will be taxed at 12.5%. In addition, the limit of exemption for capital gains will be set at Rs 1.25 lakh.
- Infrastructure spending was maintained at ₹11.1 trillion, matching the interim budget level. It is now 3.4% of GDP. The allocation for interest-free loans to states for infrastructure development is currently ₹1.5 trillion.
- According to India Budget, Securities transactiontax on futures and options will be raised to 0.02% and 0.01%, respectively. Short-term gains on some financial assets to attract 20%, said Nirmala Sitharaman. However, the Indian government propose to reduce corporate tax rate on foreign cos.
- India’s foreign exchange has risen by nearly $15 billion in the first half of July, reaching a historic high of $667 billion.
- The Indian economy is likely to grow by 6.5% to 7% this year with prospects of clocking 7%-plus growth in coming years, according to the Economic Survey for 2023-24.
- New York Fed President John Williams and Fed Governor Christopher Waller noted that the US central bank is getting “closer” to where it wants to be in terms of rate cuts.
- Traders in Fed Funds Futures markets have fully priced in rate cuts in September, with at least two quarter-point reductions in 2024.
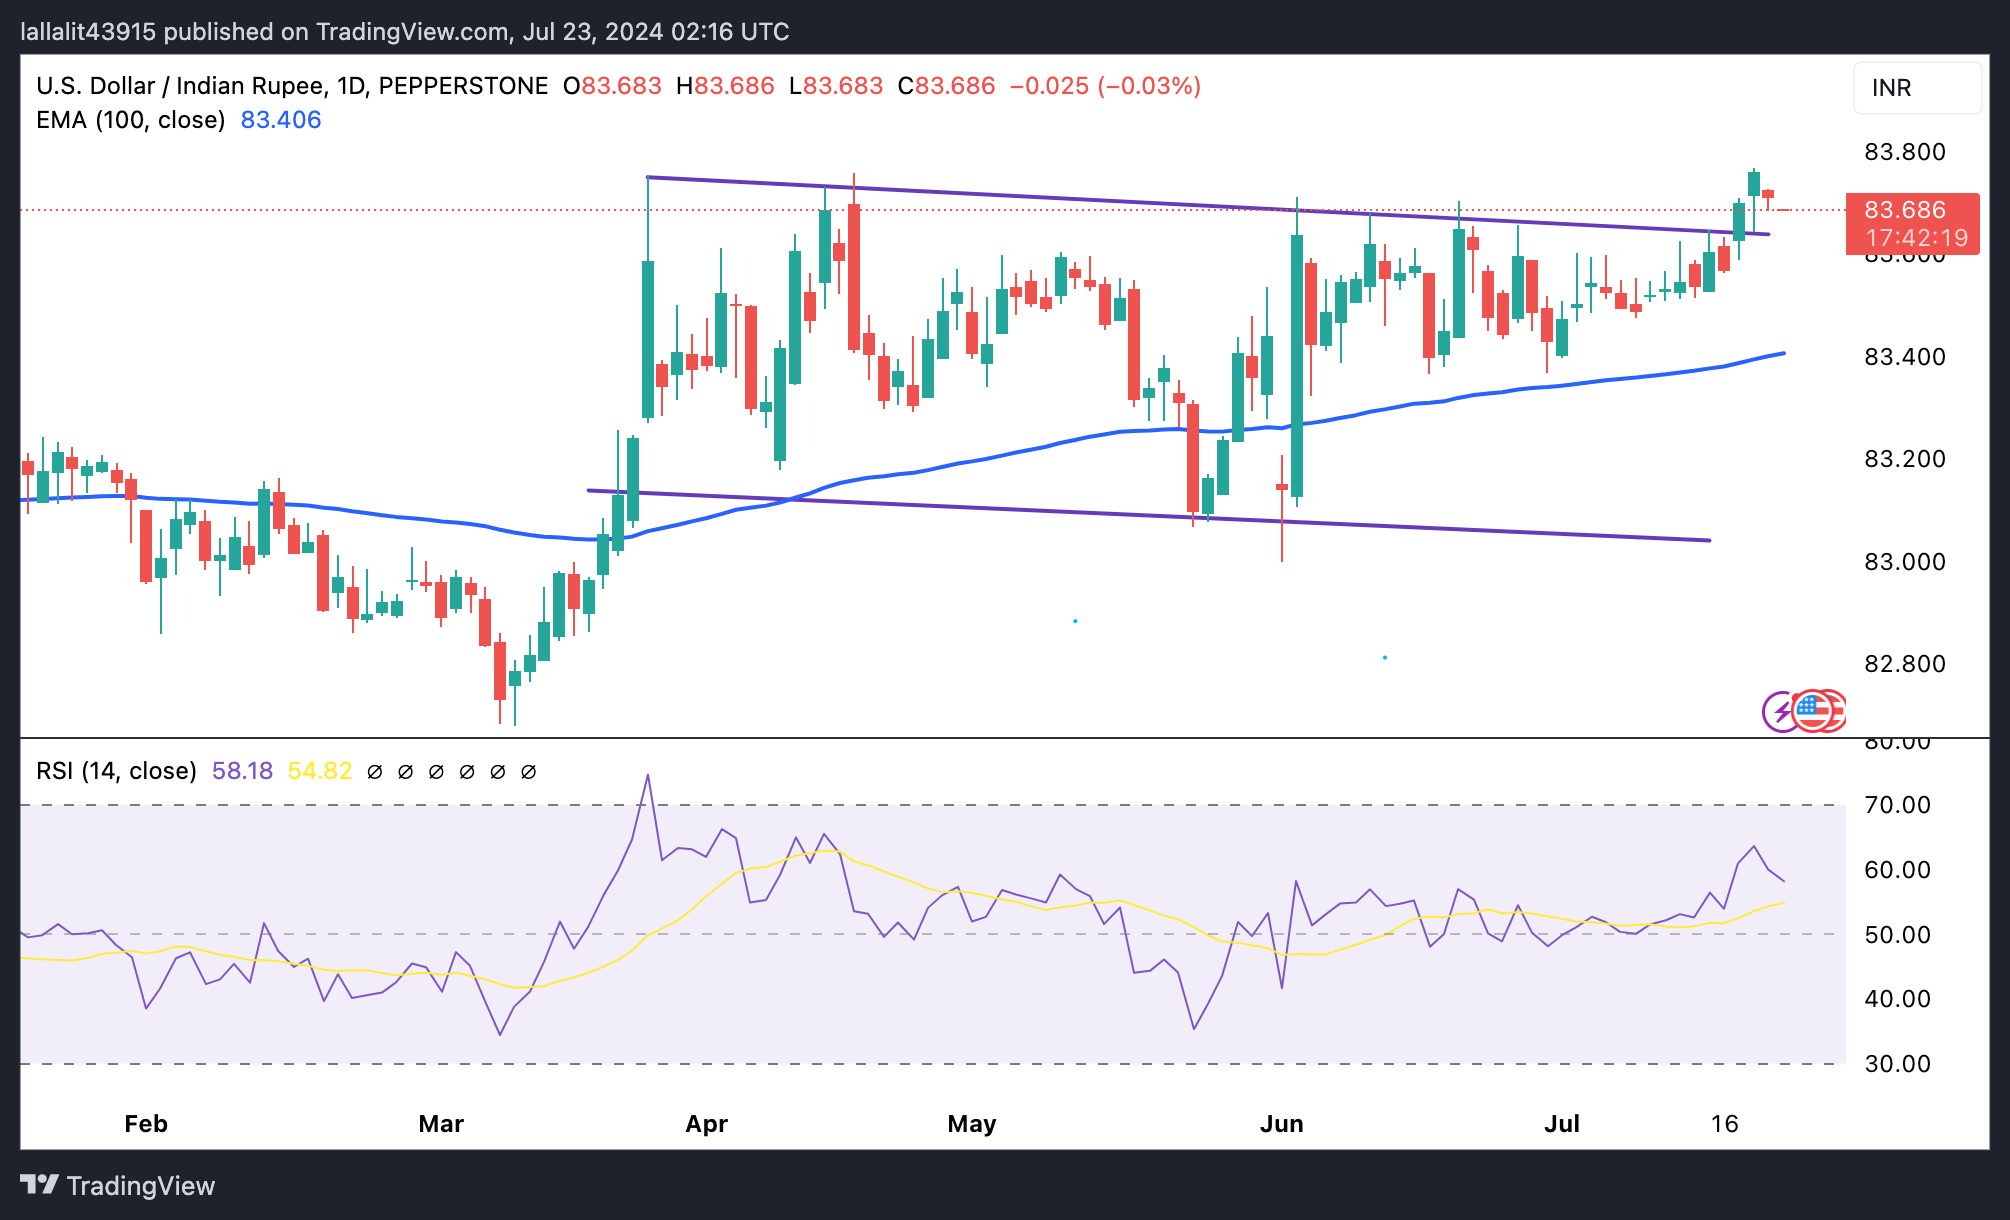
Technical analysis: USD/INR maintains a positive outlook in the longer term
The Indian Rupee trades with mild gains on the day. The USD/INR pair keeps the bullish vibe on the daily timeframe as it confirms a breakout above the month-long trading range and holds above the key 100-day Exponential Moving Average (EMA). The 14-day Relative Strength Index (RSI) points higher above 60.00, suggesting that some bullish momentum may be in play.
The first upside barrier for the pair is located near the all-time high of 83.77. A break above this level could be enough to spur some buyers to the 84.00 psychological level.
On the other hand, consistent trading below the resistance-turned-support level at 83.65 may draw in enough selling pressure to drag USD/INR lower to 83.51, a low of July 12. Further south, the pair might gain enough downside momentum to revisit 83.40, the 100-day EMA.
US Dollar price in the last 7 days
The table below shows the percentage change of US Dollar (USD) against listed major currencies in the last 7 days. US Dollar was the weakest against the Japanese Yen.
| USD | EUR | GBP | CAD | AUD | JPY | NZD | CHF | |
| USD | 0.16% | 0.40% | 0.65% | 2.02% | -1.00% | 1.84% | -0.58% | |
| EUR | -0.16% | 0.26% | 0.51% | 1.88% | -1.14% | 1.69% | -0.73% | |
| GBP | -0.40% | -0.26% | 0.25% | 1.62% | -1.40% | 1.44% | -0.99% | |
| CAD | -0.66% | -0.51% | -0.26% | 1.38% | -1.68% | 1.19% | -1.25% | |
| AUD | -2.07% | -1.92% | -1.66% | -1.40% | -3.08% | -0.21% | -2.68% | |
| JPY | 1.00% | 1.14% | 1.40% | 1.64% | 3.00% | 2.81% | 0.41% | |
| NZD | -1.87% | -1.72% | -1.47% | -1.19% | 0.19% | -2.89% | -2.46% | |
| CHF | 0.58% | 0.73% | 0.98% | 1.23% | 2.59% | -0.41% | 2.40% |
The heat map shows percentage changes of major currencies against each other. The base currency is picked from the left column, while the quote currency is picked from the top row. For example, if you pick the Euro from the left column and move along the horizontal line to the Japanese Yen, the percentage change displayed in the box will represent EUR (base)/JPY (quote).
Indian Rupee FAQs
The Indian Rupee (INR) is one of the most sensitive currencies to external factors. The price of Crude Oil (the country is highly dependent on imported Oil), the value of the US Dollar – most trade is conducted in USD – and the level of foreign investment, are all influential. Direct intervention by the Reserve Bank of India (RBI) in FX markets to keep the exchange rate stable, as well as the level of interest rates set by the RBI, are further major influencing factors on the Rupee.
The Reserve Bank of India (RBI) actively intervenes in forex markets to maintain a stable exchange rate, to help facilitate trade. In addition, the RBI tries to maintain the inflation rate at its 4% target by adjusting interest rates. Higher interest rates usually strengthen the Rupee. This is due to the role of the ‘carry trade’ in which investors borrow in countries with lower interest rates so as to place their money in countries’ offering relatively higher interest rates and profit from the difference.
Macroeconomic factors that influence the value of the Rupee include inflation, interest rates, the economic growth rate (GDP), the balance of trade, and inflows from foreign investment. A higher growth rate can lead to more overseas investment, pushing up demand for the Rupee. A less negative balance of trade will eventually lead to a stronger Rupee. Higher interest rates, especially real rates (interest rates less inflation) are also positive for the Rupee. A risk-on environment can lead to greater inflows of Foreign Direct and Indirect Investment (FDI and FII), which also benefit the Rupee.
Higher inflation, particularly, if it is comparatively higher than India’s peers, is generally negative for the currency as it reflects devaluation through oversupply. Inflation also increases the cost of exports, leading to more Rupees being sold to purchase foreign imports, which is Rupee-negative. At the same time, higher inflation usually leads to the Reserve Bank of India (RBI) raising interest rates and this can be positive for the Rupee, due to increased demand from international investors. The opposite effect is true of lower inflation.
Information on these pages contains forward-looking statements that involve risks and uncertainties. Markets and instruments profiled on this page are for informational purposes only and should not in any way come across as a recommendation to buy or sell in these assets. You should do your own thorough research before making any investment decisions. FXStreet does not in any way guarantee that this information is free from mistakes, errors, or material misstatements. It also does not guarantee that this information is of a timely nature. Investing in Open Markets involves a great deal of risk, including the loss of all or a portion of your investment, as well as emotional distress. All risks, losses and costs associated with investing, including total loss of principal, are your responsibility. The views and opinions expressed in this article are those of the authors and do not necessarily reflect the official policy or position of FXStreet nor its advertisers. The author will not be held responsible for information that is found at the end of links posted on this page.
If not otherwise explicitly mentioned in the body of the article, at the time of writing, the author has no position in any stock mentioned in this article and no business relationship with any company mentioned. The author has not received compensation for writing this article, other than from FXStreet.
FXStreet and the author do not provide personalized recommendations. The author makes no representations as to the accuracy, completeness, or suitability of this information. FXStreet and the author will not be liable for any errors, omissions or any losses, injuries or damages arising from this information and its display or use. Errors and omissions excepted.
The author and FXStreet are not registered investment advisors and nothing in this article is intended to be investment advice.
Recommended content
Editors’ Picks

EUR/USD tests fresh tops above 1.0870 on NFP
The selling bias in the US Dollar gathers extra pace on Friday after the US economy created fewer jobs than initially estimated in February, sending EUR/USD to the area of new highs around 1.0870.

GBP/USD hovers around recent highs above 1.2900
The continuation of the downward trend in the Greenback encourages GBP/USD to maintain the trade just above the 1.2900 mark following the release of US NFP in February.

Gold remains bid above $2,900 after US Payrolls
Gold prices manage to leave behind Thursday’s pullback and revisits the area of $2,920 per troy ounce in the wake of the publication of the US labour market report in February.

White House Crypto Summit could boost adoption across financial markets: Binance exec Rachel Conlan
US President Donald Trump signed an executive order for a Strategic Bitcoin Reserve on Friday, shifting industry leaders’ focus from regulation to adoption. Within just over six weeks of his term, the President is set to host the first Crypto Summit, hosting industry giants and executives from the ecosystem.

February CPI preview: The tariff winds start to blow
Consumer price inflation came out of the gate strong in 2025, but price growth looks to have cooled somewhat in February. We estimate headline CPI rose 0.25% and the core index advanced 0.27%. The moderation in the core index is likely to reflect some giveback in a handful of categories that soared in January.

The Best brokers to trade EUR/USD
SPONSORED Discover the top brokers for trading EUR/USD in 2025. Our list features brokers with competitive spreads, fast execution, and powerful platforms. Whether you're a beginner or an expert, find the right partner to navigate the dynamic Forex market.