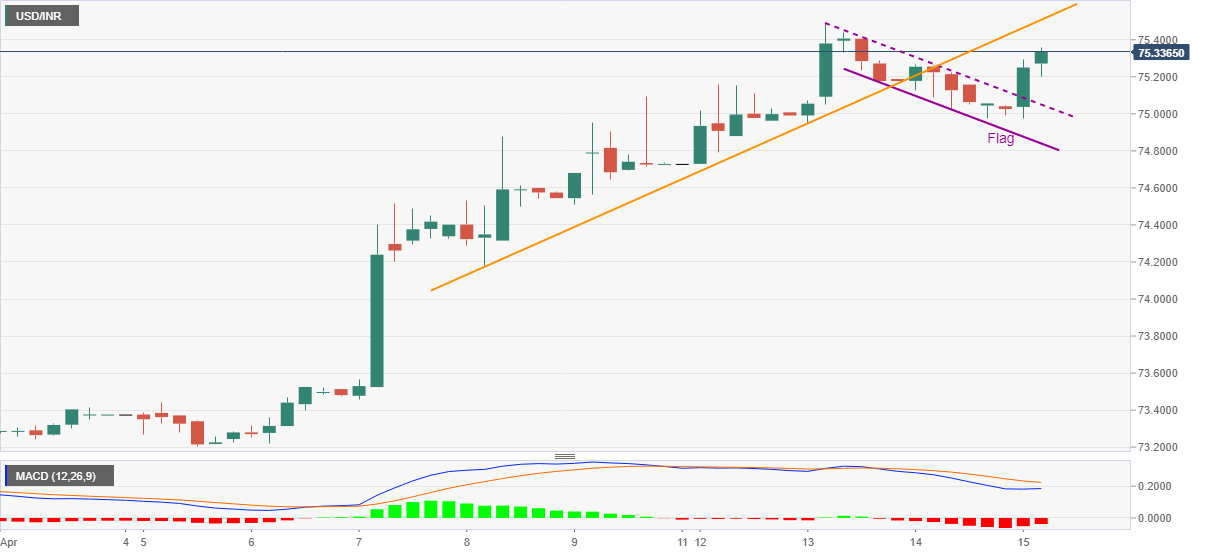
- USD/INR stays well bid after confirming a bullish chart pattern.
- Receding bearish bias of MACD directs the run-up towards one-week-old previous support line.
- Pullback moves need to revisit sub-75.00 area to recall the sellers.
USD/INR remains on the front foot around 75.35, up 0.45% intraday, amid the initial Indian session trading on Thursday. In doing so, the quote defies the recent consolidation by breaking above a short-term falling channel pattern, part of the bullish flag.
The confirmation of a bullish chart pattern joins the receding bearish bias of the MACD to direct USD/INR bulls towards the monthly high, also the highest since July, around 75.50.
However, the quote’s further upside will be tamed by the previous support line from April 08, around 75.50 by the press time.
Meanwhile, the 75.00 threshold restricts the quote’s short-term downside ahead of the flag’s support line around 74.80.
It should, however, be noted that the USD/INR weakness past-74.80 will make it vulnerable to revisit the April 08 low near 74.18 before highlighting the monthly low of 73.16.
USD/INR four-hour chart
Trend: Bullish
Information on these pages contains forward-looking statements that involve risks and uncertainties. Markets and instruments profiled on this page are for informational purposes only and should not in any way come across as a recommendation to buy or sell in these assets. You should do your own thorough research before making any investment decisions. FXStreet does not in any way guarantee that this information is free from mistakes, errors, or material misstatements. It also does not guarantee that this information is of a timely nature. Investing in Open Markets involves a great deal of risk, including the loss of all or a portion of your investment, as well as emotional distress. All risks, losses and costs associated with investing, including total loss of principal, are your responsibility. The views and opinions expressed in this article are those of the authors and do not necessarily reflect the official policy or position of FXStreet nor its advertisers. The author will not be held responsible for information that is found at the end of links posted on this page.
If not otherwise explicitly mentioned in the body of the article, at the time of writing, the author has no position in any stock mentioned in this article and no business relationship with any company mentioned. The author has not received compensation for writing this article, other than from FXStreet.
FXStreet and the author do not provide personalized recommendations. The author makes no representations as to the accuracy, completeness, or suitability of this information. FXStreet and the author will not be liable for any errors, omissions or any losses, injuries or damages arising from this information and its display or use. Errors and omissions excepted.
The author and FXStreet are not registered investment advisors and nothing in this article is intended to be investment advice.
Recommended content
Editors’ Picks

GBP/USD clings to recovery gains above 1.2650 after UK data
GBP/USD clings to recovery gains above 1.2650 in European trading on Friday. The mixed UK GDP and industrial data fail to deter Pound Sterling buyers as the US Dollar takes a breather ahead of Retail Sales and Fedspeak.

EUR/USD rises to near 1.0550 after rebounding from yearly lows
EUR/USD rebounds to near 1.0550 in the European session on Friday, snapping its five-day losing streak. The renewed upside is mainly lined to a oause in the US Dollar rally, as traders look to the topt-tier US Retail Sales data for a fresh boost. ECB- and Fedspeak also eyed.

Gold defends key $2,545 support; what’s next?
Gold price is looking to build on the previous rebound early Friday in search of a fresh impetus amid persistent US Dollar buying and mixed activity data from China.

Bitcoin to 100k or pullback to 78k?
Bitcoin and Ethereum showed a modest recovery on Friday following Thursday's downturn, yet momentum indicators suggest continuing the decline as signs of bull exhaustion emerge. Ripple is approaching a key resistance level, with a potential rejection likely leading to a decline ahead.

Trump vs CPI
US CPI for October was exactly in line with expectations. The headline rate of CPI rose to 2.6% YoY from 2.4% YoY in September. The core rate remained steady at 3.3%. The detail of the report shows that the shelter index rose by 0.4% on the month, which accounted for 50% of the increase in all items on a monthly basis.

Best Forex Brokers with Low Spreads
VERIFIED Low spreads are crucial for reducing trading costs. Explore top Forex brokers offering competitive spreads and high leverage. Compare options for EUR/USD, GBP/USD, USD/JPY, and Gold.
