|

USD/INR Price Analysis: Weekly hurdle prods Indian Rupee recovery near 82.20

  • USD/INR struggles for clear directions after snapping three-day uptrend the previous day.
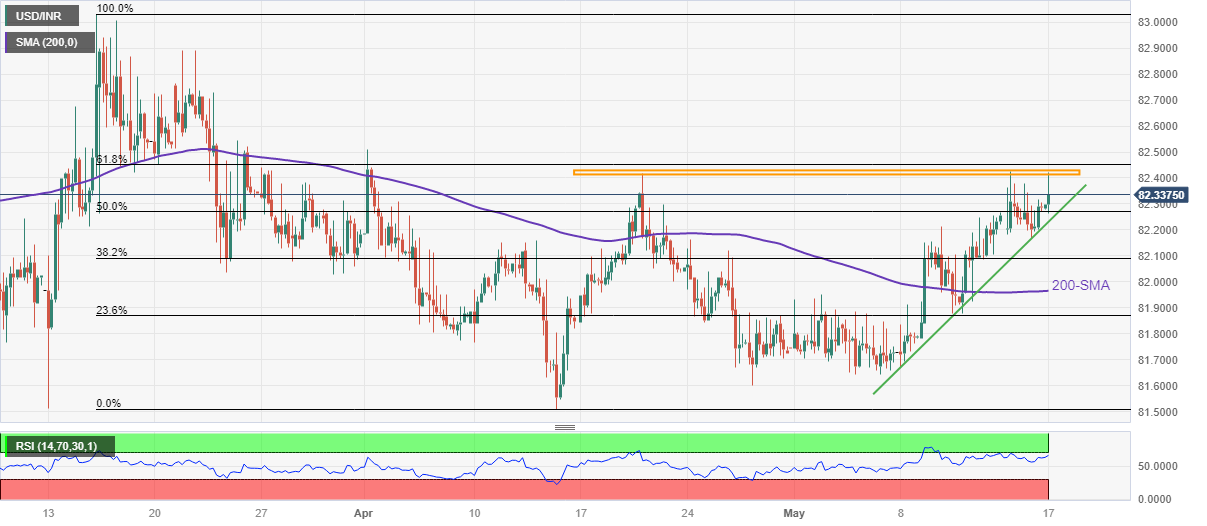
  • One-month-old horizontal region, ascending trend line from May 07 limit immediate moves of Indian Rupee pair.
  • Upbeat RSI (14) suggests continuation of northward grind; 200-SMA acts as the last defense of USD/INR bulls.

USD/INR treads water around 82.30 as it jostles with the one-month-old horizontal resistance area during early Wednesday.

That said, the Indian Rupee (INR) pair retreated from the stated hurdle surrounding 82.40-42 the previous day while printing the first daily loss in four.

However, the upbeat RSI (14) line, not overbought, favors the extension of the Indian Rupee (INR) pair’s slow grind toward the north triggered earlier in May. With this, the USD/INR pair buyers are hopeful of overcoming the 82.42 resistance zone.

Following that, the 61.8% Fibonacci retracement level of the pair’s March-April downside, near 82.45 and the previous monthly high of around 82.50 may check the USD/INR bulls before directing them to the March’s high of 83.03.

Alternatively, a one-week-old ascending support line, close to 82.20 by the press time, puts a floor under the USD/INR prices for the short term.

In a case where the USD/INR breaks the 82.20 support, the 82.00 psychological magnet and the 200-SMA surrounding 81.95 could probe the pair sellers before giving them control.

To sum up, USD/INR is expected to keep the latest upside move but the road toward the north is long and bumpy.

USD/INR: Four-hour chart

Trend: Gradual upside expected

Additional important levels

Overview
Today last price82.3034
Today Daily Change0.0095
Today Daily Change %0.01%
Today daily open82.2939
 
Trends
Daily SMA2081.9582
Daily SMA5082.0913
Daily SMA10082.1439
Daily SMA20081.7285
 
Levels
Previous Daily High82.3785
Previous Daily Low82.1655
Previous Weekly High82.2658
Previous Weekly Low81.669
Previous Monthly High82.5092
Previous Monthly Low81.485
Daily Fibonacci 38.2%82.2469
Daily Fibonacci 61.8%82.2971
Daily Pivot Point S182.1801
Daily Pivot Point S282.0663
Daily Pivot Point S381.9671
Daily Pivot Point R182.3931
Daily Pivot Point R282.4923
Daily Pivot Point R382.6061

Author

Anil Panchal

Anil Panchal

FXStreet

Anil Panchal has nearly 15 years of experience in tracking financial markets. With a keen interest in macroeconomics, Anil aptly tracks global news/updates and stays well-informed about the global financial moves and their implications.

More from Anil Panchal
Share:

Editor's Picks

EUR/USD looks to stabilize near 1.1600 as focus shifts to US data

EUR/USD is looking to stabilize near 1.1600 in the European session on Wednesday as traders breathe a sigh of relief before the top-tier US ADP jobs and ISM Services PMI data. A pause in the US Dollar uptrend helps the pair's recovery, but surging energy prices due to the Iran war will likely remain a drag. 

GBP/USD stays weak near 1.3350 as USD preserves gains

GBP/USD stays in the red below 1.3350 in the European session on Wednesday. Escalating conflict in the Middle East keeps the "flight to safety" theme intact, supporting the US Dollar against the Pound Sterling. Traders will take more cues from the US ADP Employment and ISM Services Purchasing Managers Index reports, which are due later on Wednesday. 

Gold sticks to intraday gains above $5,150; upside seems limited amid bullish USD

Gold preserves its modest intraday gains through the Asian session on Wednesday and currently trades just above the $5,150 level, up around 1.30% for the day. Investors remain concerned about a prolonged conflict in the Middle East and its impact on the global economy amid an already uncertain environment. 

Bitcoin, Ethereum and Ripple struggle for direction as consolidation persists

Bitcoin, Ethereum and Ripple prices trade with a cautious tone at the time of writing on Wednesday as upside momentum continues to fade across the broader crypto market. BTC remains within a parallel channel, ETH struggles below key resistance, while XRP remains fragile within a descending channel. These top three cryptocurrencies by market capitalization continue to struggle to establish a directional bias amid the consolidation phase.

Asian stocks fall as South Korea’s KOSPI slumps over 10%

Asian equities drop on Middle East tensions; the MSCI Asia Pacific Index falls up to 4%. South Korea’s KOSPI fell 10.71% near 5,170, with the Korean Won weakened past 1,500 per dollar.

Solana Price Forecast: SOL consolidation near resistance as ETF inflows offer mild support

Solana price is facing slight rejection as it approaches the upper boundary of the consolidation range at around $88 on Wednesday. Institutional demand is strengthening as spot Exchange Traded Funds recorded two consecutive inflows so far this week.