|

USD/INR Price Analysis: Retreats further from multi-week peak, holds above 83.00 mark

  • USD/INR drifts lower for the second successive day, albeit lacks follow-through selling.
  • The technical setup supports prospects for the emergence of dip-buying at lower levels.
  • A convincing break below the 200-day SMA is needed to negate the positive outlook.

The USD/INR pair remains under some selling pressure for the second successive day on Friday amid a modest US Dollar (USD) weakness, albeit manages to hold above the 83.00 mark heading into the European session.

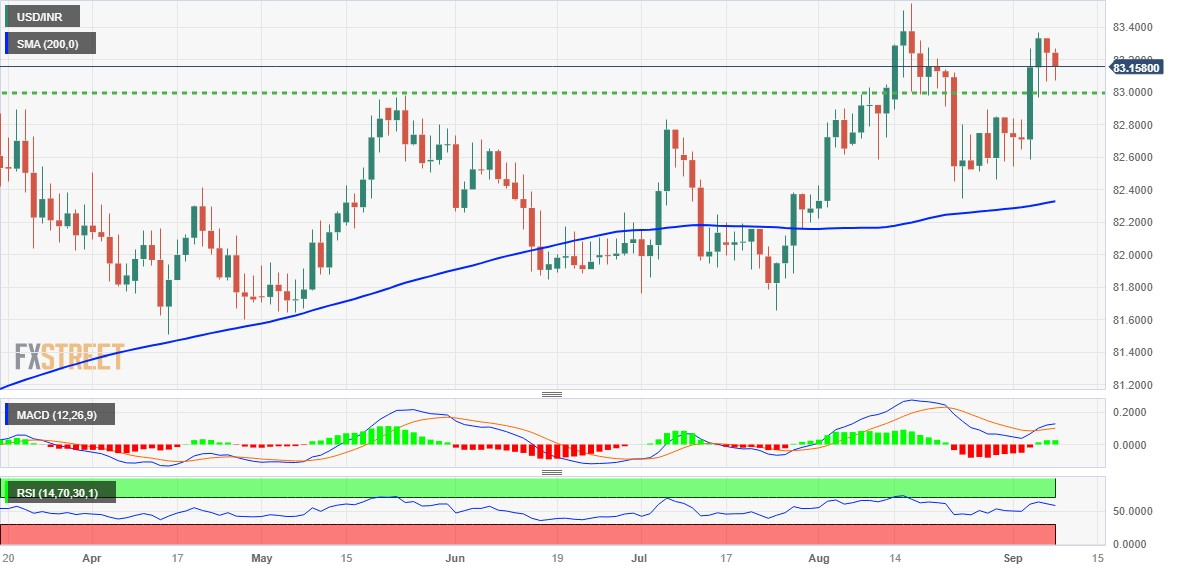
The said handle represents a strong horizontal resistance breakpoint and should act as a pivotal point for intraday traders, which if broken might prompt some technical selling and pave the way for deeper losses. That said, oscillators on the daily chart are holding comfortably in the positive territory and are still far from being in the overbought zone. This, in turn, supports prospects for the emergence of some dip-buying at lower levels and should help limit any further losses for the USD/INR pair.

Some follow-through selling below the 82.85-82.80 region, however, might expose the weekly low, around the 82.60-82.55 zone. The next relevant support is pegged near the 82.35 area (August 24 low), which coincides with a technically significant 200-day Simple Moving Average (SMA). A convincing break below might shift the near-term bias in favour of bearish traders and make the USD/INR pair vulnerable to accelerate the slide towards retesting sub-82.00 levels.

On the flip side, the 83.35-83.40 area, or a three-week top touched on Wednesday, could now provide some resistance to the upside ahead of the record high, around the 83.55 region set on August 16. Bulls need to wait for a sustained strength beyond the latter before positioning for any further appreciating move. The subsequent move-up should allow the USD/INR bulls to aim to conquer the 84.00 round-figure mark.

USD/INR daily chart

fxsoriginal

Technical levels to watch

USD/INR

Overview
Today last price83.1462
Today Daily Change-0.0982
Today Daily Change %-0.12
Today daily open83.2444
 
Trends
Daily SMA2082.9587
Daily SMA5082.5891
Daily SMA10082.3951
Daily SMA20082.3213
 
Levels
Previous Daily High83.3348
Previous Daily Low83.0697
Previous Weekly High82.8978
Previous Weekly Low82.4635
Previous Monthly High83.5505
Previous Monthly Low82.224
Daily Fibonacci 38.2%83.1709
Daily Fibonacci 61.8%83.2335
Daily Pivot Point S183.0979
Daily Pivot Point S282.9512
Daily Pivot Point S382.8328
Daily Pivot Point R183.3629
Daily Pivot Point R283.4814
Daily Pivot Point R383.628

Author

Haresh Menghani

Haresh Menghani is a detail-oriented professional with 10+ years of extensive experience in analysing the global financial markets.

More from Haresh Menghani
Share:

Editor's Picks

EUR/USD recovers some early losses driven by rising energy prices amid US-Iran war

The EUR/USD pair claws back some of its early losses during the late Asian trading session on Monday, but is still 0.25% down to near 1.1780. Earlier in the day, the Euro declined sharply against the US Dollar as investors shifted to the safe-haven fleet amid the brutal war between Iran, Israel, and the United States, which broke out over the weekend.

GBP/USD targets 1.3500 barrier near moving averages

GBP/USD rebounds from the daily losses, trading around 1.3450 during the Asian hours on Monday. The technical analysis of the daily chart indicates an ongoing bearish bias, as the pair trades within a descending channel pattern.

Gold looks further north as Iran war boosts haven demand

Gold is taking a breather after the initial run to over one-month highs near $5,400, kicking off the new week with a bang. A global flight to safety theme, following the US-Israel joint attacks on Iran over the weekend, bolstered the demand for the traditional store of value, Gold.

Bitcoin, Ethereum and Ripple under pressure as key supports face breakdown risk

Bitcoin, Ethereum, and Ripple prices trade on the back foot at the start of this week on Monday, after extending losses in the previous week. BTC is on the brink of a breakdown, ETH is capped below key resistance, and XRP risks a crack of the trendline.

The market is paying for insurance, not apocalypse

As expected, this morning felt less like a Monday market open and more like a fire drill. Futures screens flickered red. S&P contracts down almost 1%. Nasdaq off 1.2%. Brent leaped 13% through $80. Gold rose 1.6% toward $5350 before paring some gains. The dollar is strutting mildly. The Swiss franc is quietly doing what it always does in a storm, catching some safe-haven flows.

Starknet unveils strkBTC, shielded Bitcoin transactions on Ethereum Layer 2

Starknet, the Ethereum Layer 2 network developed by StarkWare, today announced strkBTC, a wrapped Bitcoin asset that introduces optional shielding while preserving full DeFi composability.