USD/INR Price Analysis: Rebounds firmly from 81.30 but the upside looks capped


  • USD/INR has displayed a responsive buying action amid a recovery in US Treasury yields.
  • The 20-and 50-EMAs are on the verge of delivering a bearish crossover around 82.15.
  • A bearish range shift by the RSI (14) has triggered the downside momentum.

The USD/INR pair has witnessed a responsive buying action to near the critical support of 81.00 in the Asian session. The Indian Rupee asset has witnessed buying interest again amid a recovery in the US Treasury yields. Also, a marginal rebound in the US Dollar Index (DXY) has supported USD/INR.  

Meanwhile, the S&P500 futures have sensed selling pressure as investors have trimmed their longs in Asia after remaining bullish in the past three trading sessions. The US Dollar Index is aiming to shift its auction profile above the critical resistance of 102.00.

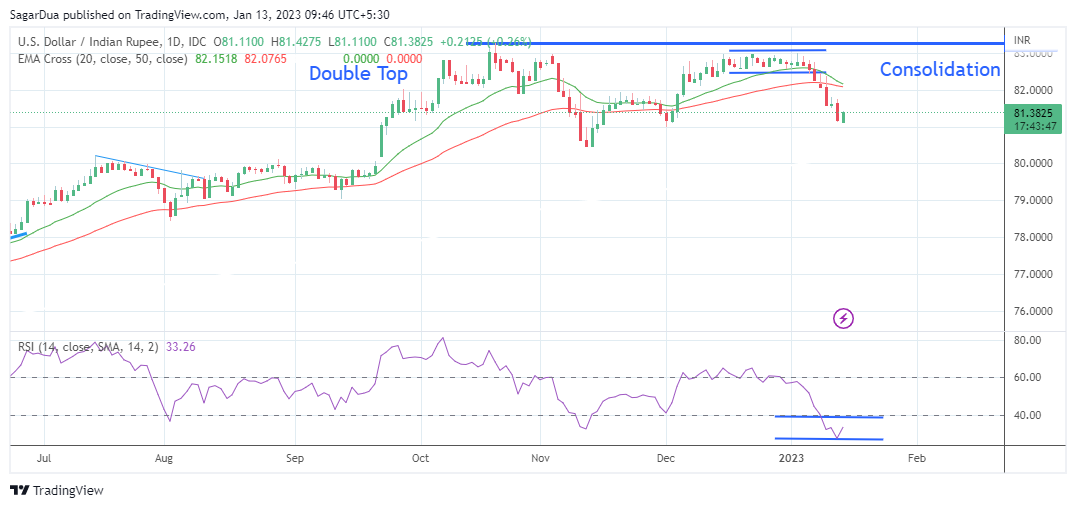
USD/INR has witnessed a sell-off after a breakdown of the consolidation formed in a range of 82.56-82.96 on a daily scale. On a broader note, the formation of the Double Top chart pattern around 83.29 triggered a bearish reversal.

The 20-and 50-period Exponential Moving Averages (EMAs) are on the verge of delivering a bear cross around 82.10, which will be added to the downside bias.

Also, the Relative Strength Index (RSI) (14) has shifted into the bearish range of 20.00-40.00, which indicates that the downside momentum is solid.

Going forward, a decisive break below the December low at 81.00 will further drag the asset towards September 23 low at 80.78 followed by November 11 low at 80.48.

On the flip side, a rebound move above November 21 high at around 82.00 will drive the asset toward December 15 low at 82.42. A breach above the latter will expose the asset to reach January high around 83.00.

USD/INR daily chart

USD/INR

Overview
Today last price 81.3975
Today Daily Change 0.3003
Today Daily Change % 0.37
Today daily open 81.0972
 
Trends
Daily SMA20 82.4991
Daily SMA50 82.0307
Daily SMA100 81.6378
Daily SMA200 79.9215
 
Levels
Previous Daily High 81.782
Previous Daily Low 81.0769
Previous Weekly High 83.072
Previous Weekly Low 82.1896
Previous Monthly High 84.25
Previous Monthly Low 80.9855
Daily Fibonacci 38.2% 81.3462
Daily Fibonacci 61.8% 81.5127
Daily Pivot Point S1 80.8554
Daily Pivot Point S2 80.6136
Daily Pivot Point S3 80.1503
Daily Pivot Point R1 81.5605
Daily Pivot Point R2 82.0238
Daily Pivot Point R3 82.2656


Share: Feed news

Information on these pages contains forward-looking statements that involve risks and uncertainties. Markets and instruments profiled on this page are for informational purposes only and should not in any way come across as a recommendation to buy or sell in these assets. You should do your own thorough research before making any investment decisions. FXStreet does not in any way guarantee that this information is free from mistakes, errors, or material misstatements. It also does not guarantee that this information is of a timely nature. Investing in Open Markets involves a great deal of risk, including the loss of all or a portion of your investment, as well as emotional distress. All risks, losses and costs associated with investing, including total loss of principal, are your responsibility. The views and opinions expressed in this article are those of the authors and do not necessarily reflect the official policy or position of FXStreet nor its advertisers. The author will not be held responsible for information that is found at the end of links posted on this page.

If not otherwise explicitly mentioned in the body of the article, at the time of writing, the author has no position in any stock mentioned in this article and no business relationship with any company mentioned. The author has not received compensation for writing this article, other than from FXStreet.

FXStreet and the author do not provide personalized recommendations. The author makes no representations as to the accuracy, completeness, or suitability of this information. FXStreet and the author will not be liable for any errors, omissions or any losses, injuries or damages arising from this information and its display or use. Errors and omissions excepted.

The author and FXStreet are not registered investment advisors and nothing in this article is intended to be investment advice.

Recommended content


Recommended content

Editors’ Picks

AUD/USD advances toward 0.6300 on  tariff optimism, China support

AUD/USD advances toward 0.6300 on tariff optimism, China support

AUD/USD is rising further toward 0.6300 in the Asian session on Monday. The Aussie gains support from speculations surrounding narrower US reciprocal tariffs due to be announced on April 2. Further, strong Australian Manufacturing PMI data, Chinese support measures and a subdued US Dollar underpin the pair. 

AUD/USD News
USD/JPY falls from near 150.00 after Japanese commentary

USD/JPY falls from near 150.00 after Japanese commentary

USD/JPY turns south after facing rejection just shy of 150.00 in the Asian session on Monday. The pair pares gains following the commentaries from Japanese Finance Minister Kato and BoJ policymaker Uchida. Hopes of the next BoJ meeting being the 'live one' and weaker US Dollar also cap the pair's upside. 

USD/JPY News
Gold price is down but not out while $2,950 support holds

Gold price is down but not out while $2,950 support holds

The gold price is trading on the back foot early Monday, looking to continue Friday’s correction from its all-time high of $3,058. Gold price bears the brunt of a risk-on market profile, diminishing its safe-haven appeal.

Gold News
Bitcoin, Ethereum and Ripple consolidate before a potential breakout

Bitcoin, Ethereum and Ripple consolidate before a potential breakout

Bitcoin hovers around $85,600 on Monday after recovering 4.25% last week. Ethereum and Ripple also followed in BTC’s footsteps, hovering around their key levels after recovering almost 7% each the previous week. 

Read more
Week ahead – Flash PMIs, US and UK inflation eyed as tariff war rumbles on

Week ahead – Flash PMIs, US and UK inflation eyed as tariff war rumbles on

US PCE inflation up next, but will consumption data matter more? UK budget and CPI in focus after hawkish BoE decision. Euro turns to flash PMIs for bounce as rally runs out of steam. Inflation numbers out of Tokyo and Australia also on the agenda.

Read more
The Best brokers to trade EUR/USD

The Best brokers to trade EUR/USD

SPONSORED Discover the top brokers for trading EUR/USD in 2025. Our list features brokers with competitive spreads, fast execution, and powerful platforms. Whether you're a beginner or an expert, find the right partner to navigate the dynamic Forex market.

Read More

Forex MAJORS

Cryptocurrencies

Signatures

Best Brokers of 2025