USD/INR Price Analysis: Indian Rupee struggles around 82.50 as 50-DMA probes buyers


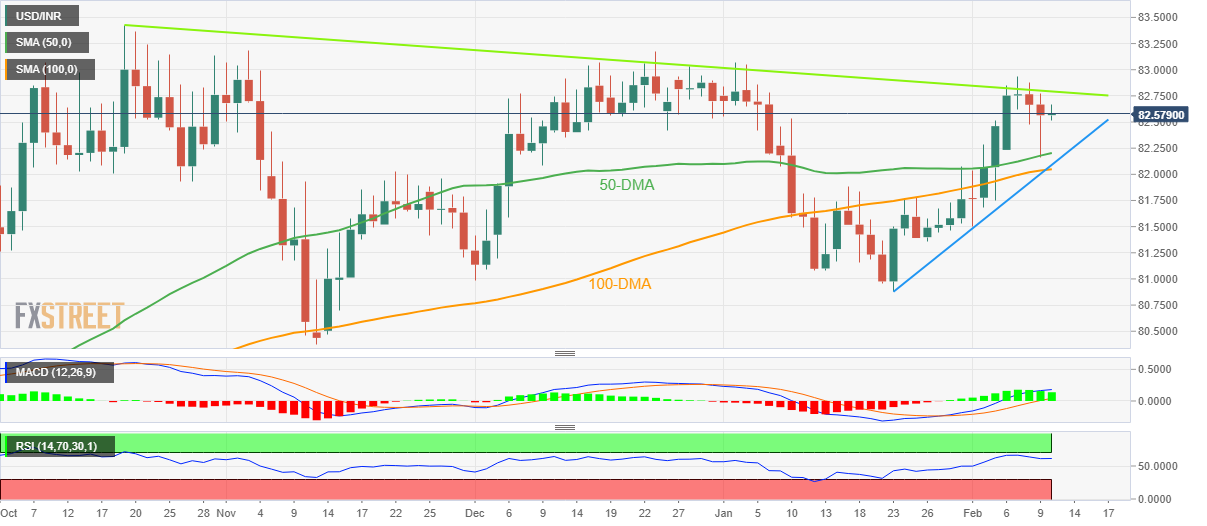
  • USD/INR remains sidelined between four-month-old resistance line and 50-DMA.
  • A convergence of 100-DMA, ascending trend line from late January appears a tough nut to crack for the pair sellers.
  • Indian Rupee sellers need successful break of 82.80 to retake control.

USD/INR remains indecisive around 82.60, challenging the two-day losing streak, as Indian Rupee traders seek fresh clues during early Friday. In doing so, the pair also takes clues from the cautious mood in the market ahead of the early signals for the US inflation, namely preliminary readings of February’s US Michigan Consumer Sentiment Index and 5-year Consumer Inflation Expectations.

That said, the quote’s trading within the key technical hurdles also challenges the momentum traders of late.

It’s worth observing that the bullish MACD signals and firmer RSI (14), however, keep the USD/INR buyers hopeful. On the same line could be the pair’s bounce off the 50-DMA.

As a result, the pair’s another attempt to cross the downward-sloping resistance line from October 2022, close to 82.80 by the press time, appears on the table.

Following that, a run-up towards the all-time high marked in late 2022 around 83.42 can’t be ruled out.

Meanwhile, the 50-DMA restricts the immediate downside of the USD/INR pair to around 82.20 before highlighting the 82.00 support confluence, which includes the 100-DMA and three-week-old ascending trend line.

If at all the USD/INR bears keep the reins past 82.00, the odds of witnessing a gradual south run towards the previous monthly low near 80.90 can’t be ruled out.

Overall, USD/INR is likely to remain depressed but the downside room appears limited, which in teases buyers to build positions for future gains.

USD/INR: Daily chart

Trend: Limited downside expected

Additional important levels

Overview
Today last price 82.595
Today Daily Change 0.0306
Today Daily Change % 0.04%
Today daily open 82.5644
 
Trends
Daily SMA20 81.7954
Daily SMA50 82.1788
Daily SMA100 82.0357
Daily SMA200 80.4669
 
Levels
Previous Daily High 82.7735
Previous Daily Low 82.1626
Previous Weekly High 82.5127
Previous Weekly Low 81.4605
Previous Monthly High 83.072
Previous Monthly Low 80.8822
Daily Fibonacci 38.2% 82.396
Daily Fibonacci 61.8% 82.5402
Daily Pivot Point S1 82.2268
Daily Pivot Point S2 81.8893
Daily Pivot Point S3 81.616
Daily Pivot Point R1 82.8377
Daily Pivot Point R2 83.111
Daily Pivot Point R3 83.4485


Share: Feed news

Information on these pages contains forward-looking statements that involve risks and uncertainties. Markets and instruments profiled on this page are for informational purposes only and should not in any way come across as a recommendation to buy or sell in these assets. You should do your own thorough research before making any investment decisions. FXStreet does not in any way guarantee that this information is free from mistakes, errors, or material misstatements. It also does not guarantee that this information is of a timely nature. Investing in Open Markets involves a great deal of risk, including the loss of all or a portion of your investment, as well as emotional distress. All risks, losses and costs associated with investing, including total loss of principal, are your responsibility. The views and opinions expressed in this article are those of the authors and do not necessarily reflect the official policy or position of FXStreet nor its advertisers. The author will not be held responsible for information that is found at the end of links posted on this page.

If not otherwise explicitly mentioned in the body of the article, at the time of writing, the author has no position in any stock mentioned in this article and no business relationship with any company mentioned. The author has not received compensation for writing this article, other than from FXStreet.

FXStreet and the author do not provide personalized recommendations. The author makes no representations as to the accuracy, completeness, or suitability of this information. FXStreet and the author will not be liable for any errors, omissions or any losses, injuries or damages arising from this information and its display or use. Errors and omissions excepted.

The author and FXStreet are not registered investment advisors and nothing in this article is intended to be investment advice.

Trading Pro
Read review
Pepperstone
Read review
Trading Pro
Read review
Pepperstone
Read review

Recommended content


Recommended content

Editors’ Picks

EUR/USD drops below 1.0800 on Trump's 'Liberation Day'

EUR/USD drops below 1.0800 on Trump's 'Liberation Day'

EUR/USD is back in the red below 1.0800 in the early European morning on Wednesday as investors rush for the safe-haven US Dollar, aniticpating US President Donald Trump’s long-threatened “reciprocal” tariffs package, due to be announced at 20:00 GMT. 

EUR/USD News
GBP/USD trades with caution above 1.2900, awaits Trump’s tariffs reveal

GBP/USD trades with caution above 1.2900, awaits Trump’s tariffs reveal

GBP/USD  is trading with caution above 1.2900 early Wednesday, struggles to capitalize on the overnight bounce amid resugent haven demand for the US Dollar. Traders remain wary heading into the US 'reciprocal tariffs' announcement on "Liberation Day' at 20:00 GMT. 

GBP/USD News
Gold price remains close to record high amid concerns over Trump’s reciprocal tariffs

Gold price remains close to record high amid concerns over Trump’s reciprocal tariffs

Gold price regains positive traction amid concerns about Trump’s aggressive trade policies. Fed rate cut bets keep the USD bulls on the defensive and further benefiting the XAU/USD pair. A broadly stable risk sentiment might cap gains ahead of Trump’s tariffs announcement. 

Gold News
Bitcoin, Ethereum and Ripple brace for volatility amid Trump’s ‘Liberation Day’

Bitcoin, Ethereum and Ripple brace for volatility amid Trump’s ‘Liberation Day’

Bitcoin price faces a slight rejection around its $85,000 resistance level on Wednesday after recovering 3.16% the previous day. Ripple follows BTC as it falls below its critical level, indicating weakness and a correction on the horizon. 

Read more
Is the US economy headed for a recession?

Is the US economy headed for a recession?

Leading economists say a recession is more likely than originally expected. With new tariffs set to be launched on April 2, investors and economists are growing more concerned about an economic slowdown or recession.

Read more
The Best brokers to trade EUR/USD

The Best brokers to trade EUR/USD

SPONSORED Discover the top brokers for trading EUR/USD in 2025. Our list features brokers with competitive spreads, fast execution, and powerful platforms. Whether you're a beginner or an expert, find the right partner to navigate the dynamic Forex market.

Read More

Forex MAJORS

Cryptocurrencies

Signatures

Best Brokers of 2025