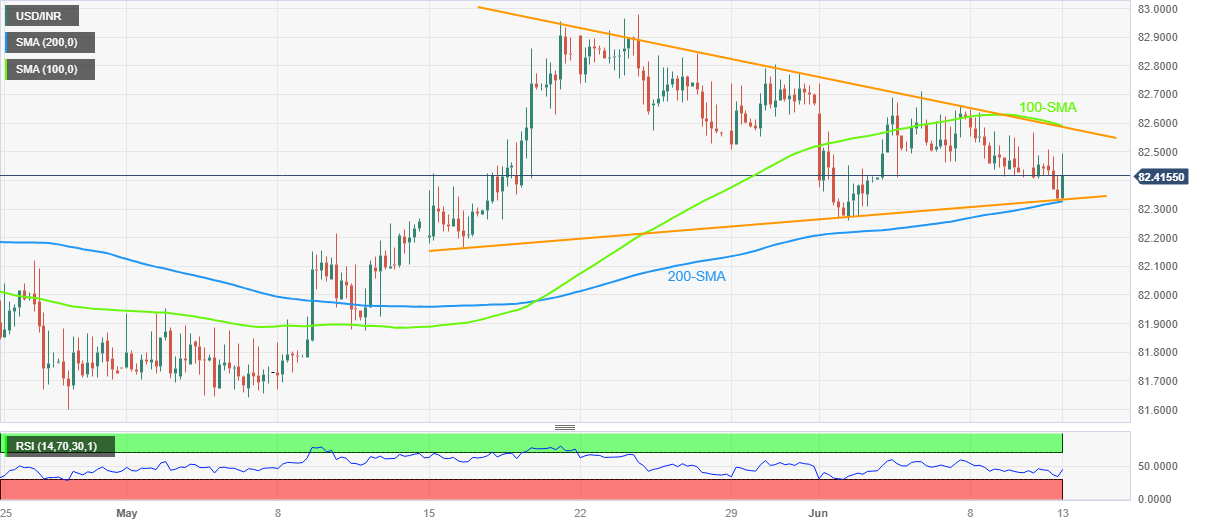
- USD/INR clings to mild gains during the first daily run-up in four.
- Convergence of 200-SMA, bottom of monthly symmetrical triangle restricts immediate downside.
- 100-SMA, triangle’s top line challenge Indian Rupee bears.
- Softer India inflation lures USD/INR buyers ahead of US CPI.
USD/INR prints mild gains around 82.45 as it extends the early-day rebound from the short-term key support confluence heading into Tuesday’s European session. In doing so, the Indian Rupee (INR) pair justifies downbeat India Consumer Price Index (CPI) data ahead of US inflation releases.
That said, India's CPI eased to 4.25% in May versus 4.42% expected and 4.70% prior, which in turn justifies the Reserve Bank of India’s (RBA) latest pause in rate hike and suggests some more inactions to come from the Indian central bank. On the other hand, the early signals for the US inflation numbers have been downbeat and hence prod the USD/INR bulls.
Also read: US Inflation Preview: Why the US Dollar is more likely to fall than rise, three scenarios
Technically, the USD/INR pair bounces off a convergence of the 200-SMA and the lower line of a one-month-old symmetrical triangle, around 82.33 by the press time.
The recovery moves also take clues from the RSI (14) line’s rebound from the oversold territory, suggesting further weakness of the Indian Rupee (INR).
Hence, the USD/INR price is likely to rise towards the short-term key upside hurdle of 82.60 comprising the 100-SMA and top line of the aforementioned triangle.
It should be noted, however, that the USD/INR pair’s run-up beyond 82.60 won’t hesitate to challenge the previous monthly high of around 83.00 whereas a downside break of 82.33 needs validation from the mid-May swing low of around 82.15 to convince the pair sellers.
USD/INR: Four-hour chart
Trend: Limited upside expected
Information on these pages contains forward-looking statements that involve risks and uncertainties. Markets and instruments profiled on this page are for informational purposes only and should not in any way come across as a recommendation to buy or sell in these assets. You should do your own thorough research before making any investment decisions. FXStreet does not in any way guarantee that this information is free from mistakes, errors, or material misstatements. It also does not guarantee that this information is of a timely nature. Investing in Open Markets involves a great deal of risk, including the loss of all or a portion of your investment, as well as emotional distress. All risks, losses and costs associated with investing, including total loss of principal, are your responsibility. The views and opinions expressed in this article are those of the authors and do not necessarily reflect the official policy or position of FXStreet nor its advertisers. The author will not be held responsible for information that is found at the end of links posted on this page.
If not otherwise explicitly mentioned in the body of the article, at the time of writing, the author has no position in any stock mentioned in this article and no business relationship with any company mentioned. The author has not received compensation for writing this article, other than from FXStreet.
FXStreet and the author do not provide personalized recommendations. The author makes no representations as to the accuracy, completeness, or suitability of this information. FXStreet and the author will not be liable for any errors, omissions or any losses, injuries or damages arising from this information and its display or use. Errors and omissions excepted.
The author and FXStreet are not registered investment advisors and nothing in this article is intended to be investment advice.
Recommended content
Editors’ Picks

EUR/USD holds above 1.0400 in quiet trading
EUR/USD trades in positive territory above 1.0400 in the American session on Friday. The absence of fundamental drivers and thin trading conditions on the holiday-shortened week make it difficult for the pair to gather directional momentum.

GBP/USD recovers above 1.2550 following earlier decline
GBP/USD regains its traction and trades above 1.2550 after declining toward 1.2500 earlier in the day. Nevertheless, the cautious market mood limits the pair's upside as trading volumes remain low following the Christmas break.

Gold declines below $2,620, erases weekly gains
Gold edges lower in the second half of the day and trades below $2,620, looking to end the week marginally lower. Although the cautious market mood helps XAU/USD hold its ground, growing expectations for a less-dovish Fed policy outlook caps the pair's upside.

Bitcoin misses Santa rally even as on-chain metrics show signs of price recovery
Bitcoin (BTC) price hovers around $97,000 on Friday, erasing most of the gains from earlier this week, as the largest cryptocurrency missed the so-called Santa Claus rally, the increase in prices prior to and immediately following Christmas Day.

2025 outlook: What is next for developed economies and currencies?
As the door closes in 2024, and while the year feels like it has passed in the blink of an eye, a lot has happened. If I had to summarise it all in four words, it would be: ‘a year of surprises’.

Best Forex Brokers with Low Spreads
VERIFIED Low spreads are crucial for reducing trading costs. Explore top Forex brokers offering competitive spreads and high leverage. Compare options for EUR/USD, GBP/USD, USD/JPY, and Gold.
