|

USD/INR Price Analysis: Focus on trendline support after biggest weekly decline since December 2018

  • USD/INR fell by 2.41% last week, the biggest weekly drop since December 2017. 
  • The weekly chart suggests scope for a sell-off to rising trendline support. 

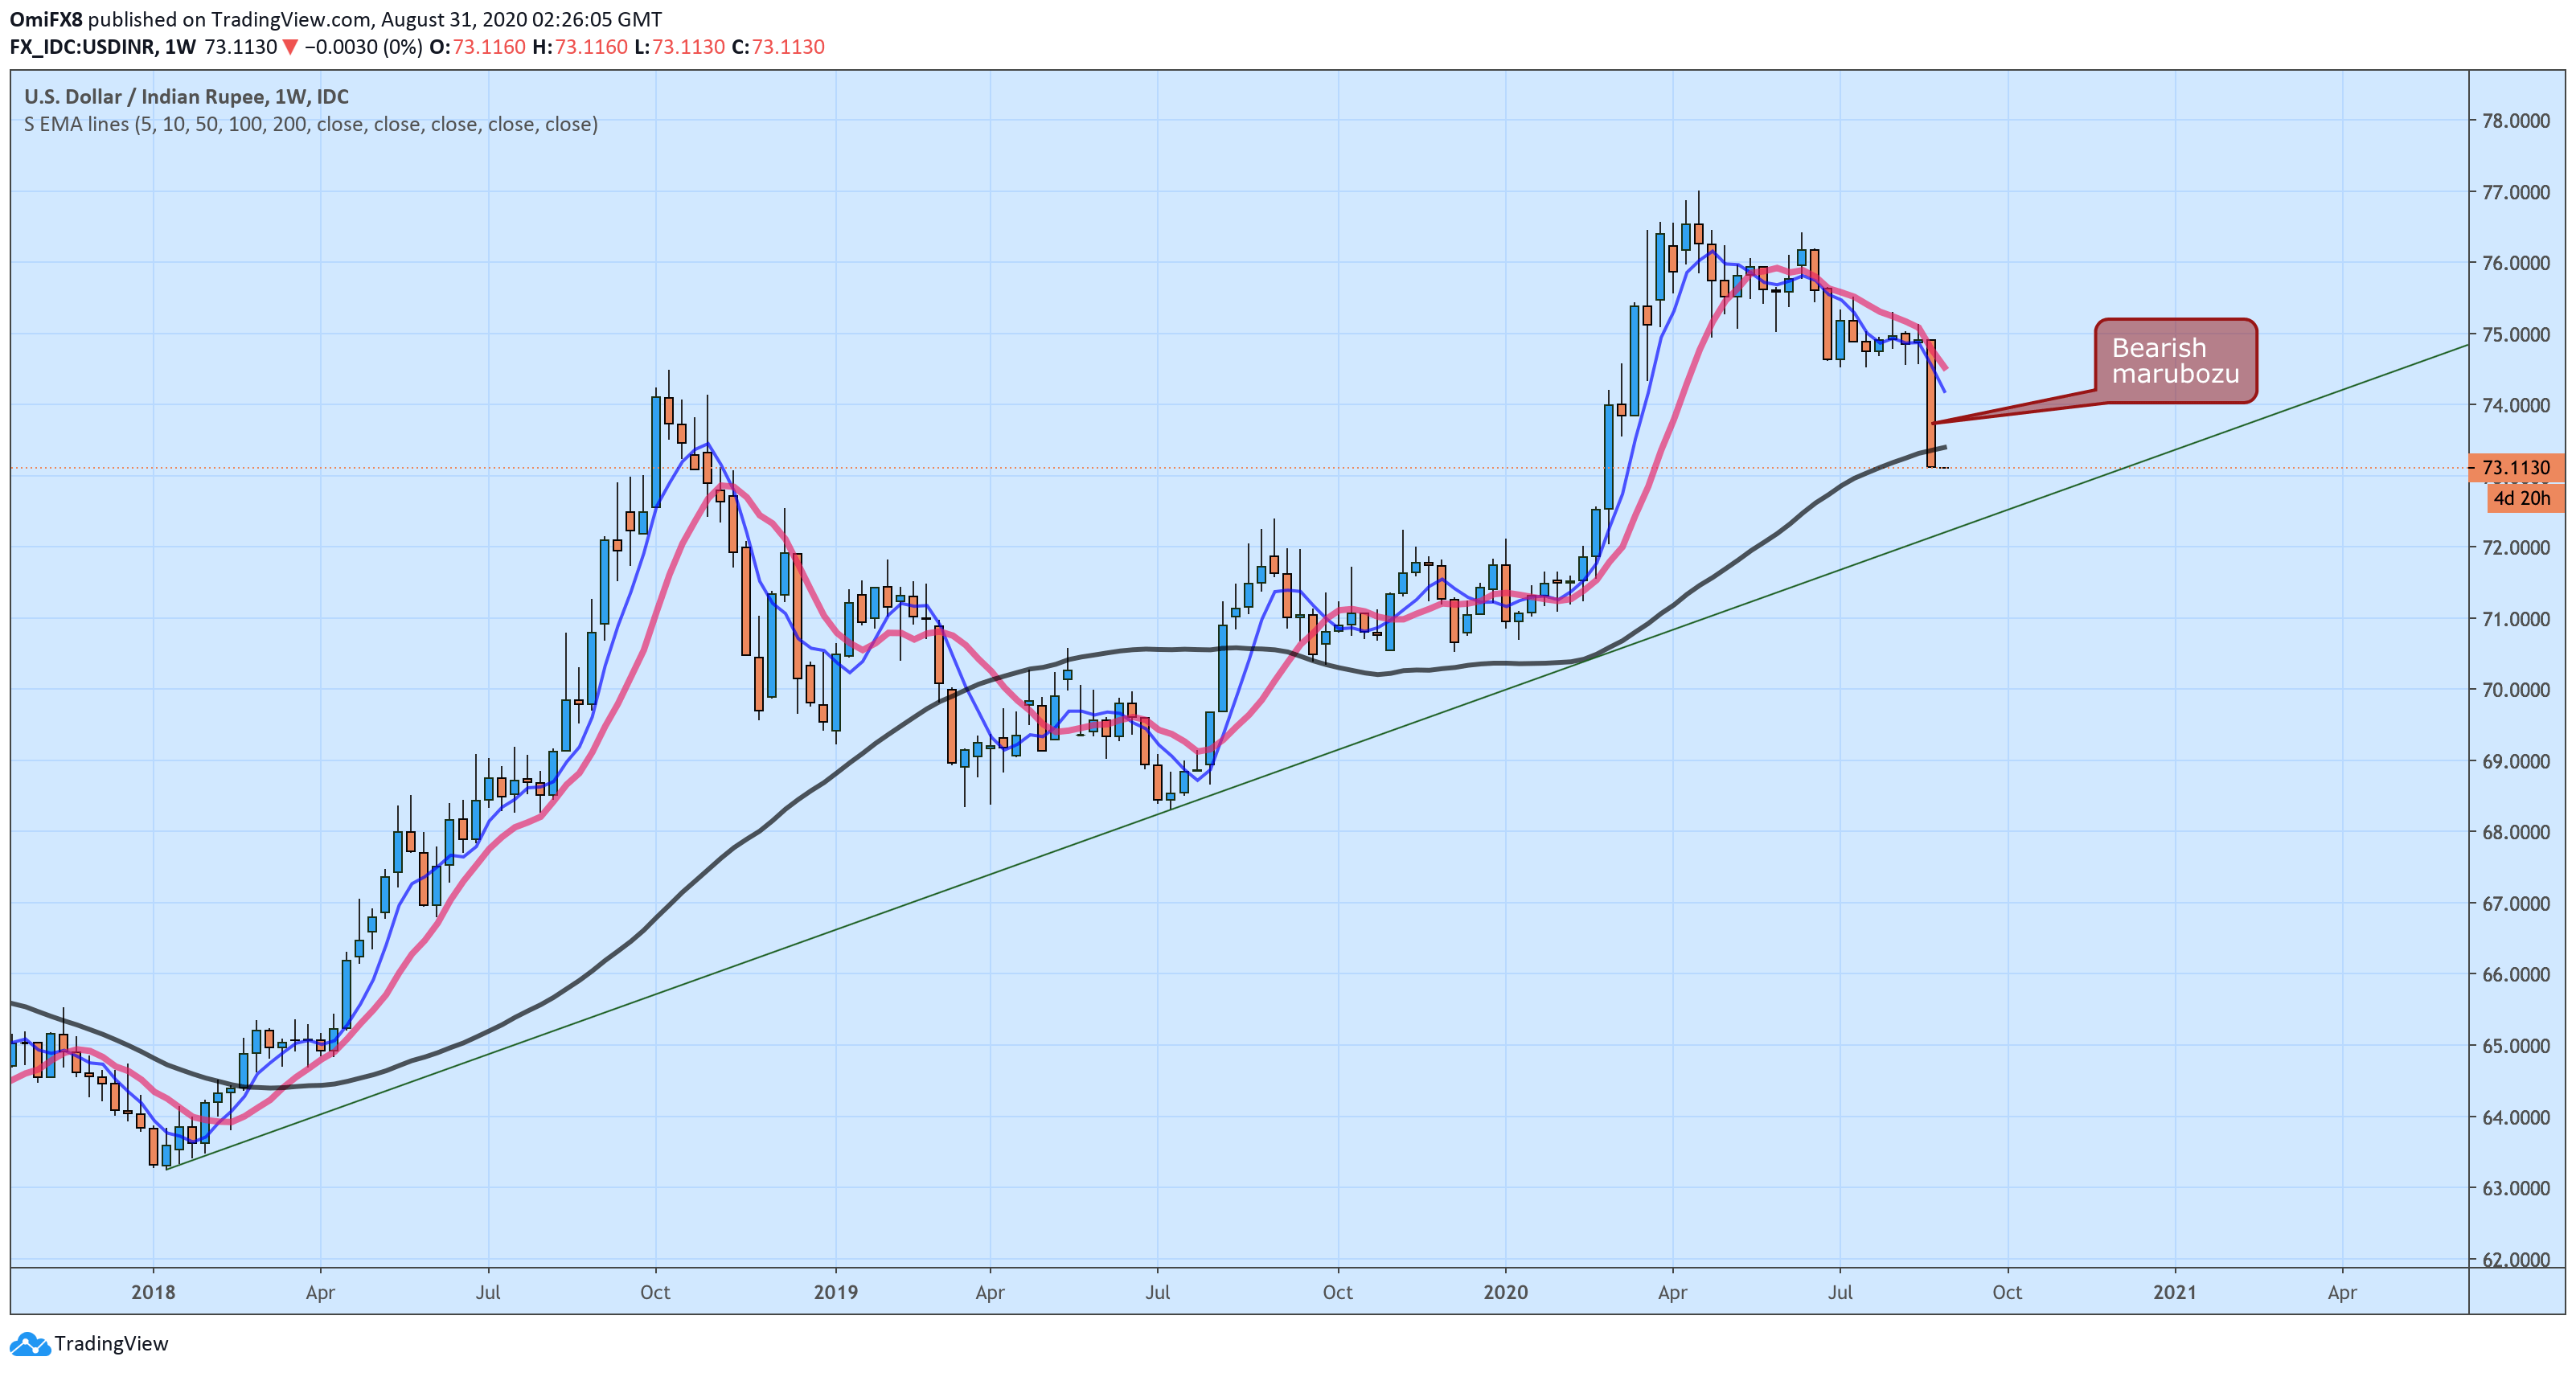
USD/INR looks south, having carved out a bearish marubozu candle last week with a 2.41% drop. That is the biggest weekly decline since December 2018. 

A bearish marubozu candle occurs when trades control the price action from day's open to close. In other words, the bearish marubozu signals the market's determination to dominantly trade in the downward direction.

As such, a drop to the trendline connecting January 2018 and July 2019 lows looks likely. At press time, the trendline support is located at 72.1820. 

Supporting the bearish case is the descending 5- and 10-day simple moving averages (SMA) and a violation of the 50-week SMA. 

Indeed, the daily chart indicators are reporting oversold conditions. Hence, a temporary bounce may be seen before a decline to the 2-1/2-year-long rising trendline. 

Weekly chart

Trend: Bearish

Technical levels

USD/INR

Overview
Today last price73.375
Today Daily Change0.2465
Today Daily Change %0.34
Today daily open73.1285
 
Trends
Daily SMA2074.6432
Daily SMA5074.9062
Daily SMA10075.385
Daily SMA20073.9025
 
Levels
Previous Daily High73.8566
Previous Daily Low73.1025
Previous Weekly High74.955
Previous Weekly Low73.1025
Previous Monthly High75.6224
Previous Monthly Low74.5052
Daily Fibonacci 38.2%73.3906
Daily Fibonacci 61.8%73.5686
Daily Pivot Point S172.8685
Daily Pivot Point S272.6084
Daily Pivot Point S372.1143
Daily Pivot Point R173.6226
Daily Pivot Point R274.1167
Daily Pivot Point R374.3768

Author

Omkar Godbole

Omkar Godbole

FXStreet Contributor

Omkar Godbole, editor and analyst, joined FXStreet after four years as a research analyst at several Indian brokerage companies.

More from Omkar Godbole
Share:

Editor's Picks

EUR/USD struggles aroound 1.1800 as USD stabilizes

EUR/USD stays defensive around 1.1800 in the European session on Thursday. The US Dollar stabilizes, following the recent decline led by tariff uncertainty, capping the pair's upside. All eyes now remain on the US-Iran nuclear talks after ECB President Lagarde's testimony fails to impress Euro bulls. 

GBP/USD drops toward 1.3500 as USD finds fresh demand

GBP/USD falls back toward 1.3500 in the European session on Thursday, snapping its recovery momentum. The pair loses traction as the US Dollar finds fresh demand, as markets turn cautious ahead of the US-Iran nuclear talks. The US trade policy uncertainty also remains a drag on risk sentiment. 

Gold clings to gains amid sustained safe-haven flows ahead of US-Iran talks

Gold sticks to its modest intraday gains through the first half of the European session on Thursday, with bulls still awaiting a sustained move and acceptance above the $5,200 mark before placing fresh bets. 

Stellar: Relief bounce fades as bearish undertone persists

Stellar is trading around $0.16 at the time of writing on Thursday after rebounding more than 8% in the previous day. Derivatives data paints a negative picture as XLM’s short bets hit a monthly high while Open Interest continues to decline.

Nvidia delivers another monster earnings report, and forecasts big things to come

It was another monster earnings report from Nvidia for fiscal Q4. Revenues were $68.1bn, smashing estimates of $65bn. Gross profit margin was a healthy 75%, up from 73.5% in the prior quarter, and the outlook for this quarter was monstrous.

Solana strikes key resistance with double-digit gains

Solana trades at $88 at press time on Thursday, after an 11% upswing the previous day within a broader consolidation range of roughly three weeks. Institutional demand for Solana heightens as US spot SOL Exchange Traded Funds record $30 million of inflow on Wednesday.