USD/INR Price Analysis: Consolidates around 82.00 mark, seems vulnerable below 200-day SMA


  • USD/INR oscillates in a narrow trading band through the Asian session on Monday.
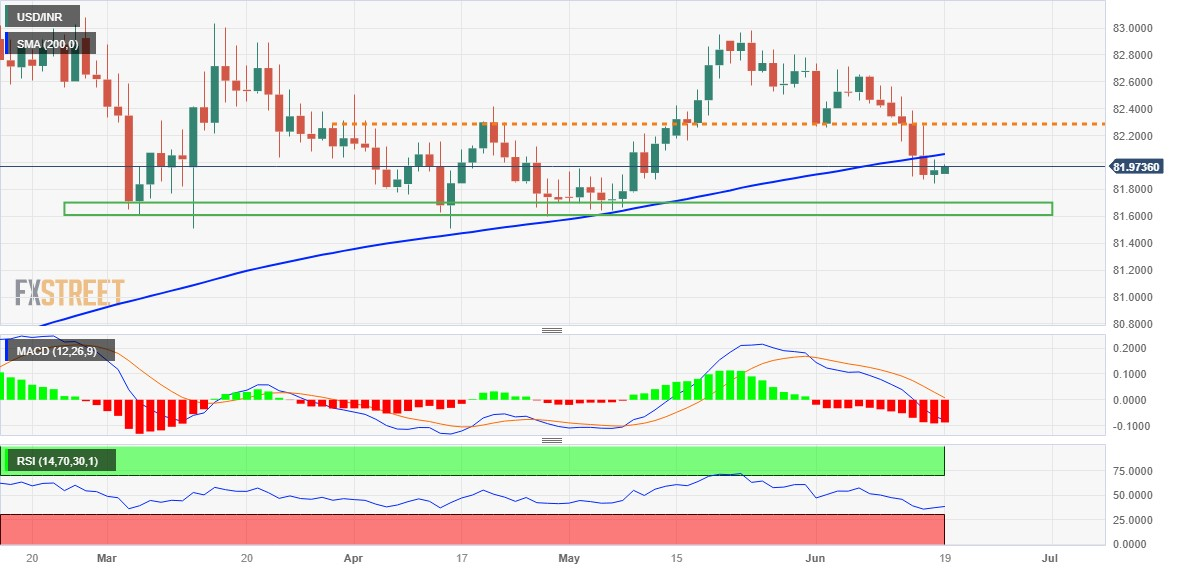
  • Last week’s sustained breakdown below the 200-day SMA favours bearish traders.
  • A sustained strength beyond the 82.30 area is needed to negate the negative bias.

The USD/INR pair struggles to capitalize on Friday's modest bounce from the 81.85 region, or its lowest level since May 9 and kicks off the new week on a subdued note. Spot prices oscillate in a narrow trading band through the Asian session and currently trade just below the 82.00 mark, nearly unchanged for the day.

From a technical perspective, last week's sustained break and acceptance below the very important 200-day Simple Moving Average (SMA) was seen as a fresh trigger for bearish traders. Moreover, oscillators on the daily chart are holding deep in the negative territory and are still far from being in the oversold zone. This, in turn, reaffirms the negative outlook and suggests that the path of least resistance for the USD/INR pair is to the downside.

Hence, a subsequent slide towards testing the next relevant support, near the 81.70-81.65 region, looks like a distinct possibility. Some follow-through selling will make a fresh breakdown and pave the way for an extension of the recent retracement slide from the vicinity of the 83.00 round-figure mark witnessed over the past four weeks or so.

On the flip side, the 200-day SMA, currently pegged around the 82.10 area, now seems to act as an immediate hurdle ahead of the 82.30 horizontal zone. A sustained strength beyond, however, might negate the negative outlook and trigger some near-term short-covering move. The USD/INR pair might then climb back towards the 82.70-82.75 hurdle before making a fresh attempt to conquer the 83.00 mark.

USD/INR daily chart

fxsoriginal

Key levels to watch

USD/INR

Overview
Today last price 81.982
Today Daily Change 0.0390
Today Daily Change % 0.05
Today daily open 81.943
 
Trends
Daily SMA20 82.473
Daily SMA50 82.2057
Daily SMA100 82.2838
Daily SMA200 82.0505
 
Levels
Previous Daily High 82.0217
Previous Daily Low 81.8477
Previous Weekly High 82.568
Previous Weekly Low 81.8477
Previous Monthly High 82.981
Previous Monthly Low 81.6435
Daily Fibonacci 38.2% 81.9552
Daily Fibonacci 61.8% 81.9142
Daily Pivot Point S1 81.8533
Daily Pivot Point S2 81.7635
Daily Pivot Point S3 81.6793
Daily Pivot Point R1 82.0273
Daily Pivot Point R2 82.1115
Daily Pivot Point R3 82.2013


Share: Feed news

Information on these pages contains forward-looking statements that involve risks and uncertainties. Markets and instruments profiled on this page are for informational purposes only and should not in any way come across as a recommendation to buy or sell in these assets. You should do your own thorough research before making any investment decisions. FXStreet does not in any way guarantee that this information is free from mistakes, errors, or material misstatements. It also does not guarantee that this information is of a timely nature. Investing in Open Markets involves a great deal of risk, including the loss of all or a portion of your investment, as well as emotional distress. All risks, losses and costs associated with investing, including total loss of principal, are your responsibility. The views and opinions expressed in this article are those of the authors and do not necessarily reflect the official policy or position of FXStreet nor its advertisers. The author will not be held responsible for information that is found at the end of links posted on this page.

If not otherwise explicitly mentioned in the body of the article, at the time of writing, the author has no position in any stock mentioned in this article and no business relationship with any company mentioned. The author has not received compensation for writing this article, other than from FXStreet.

FXStreet and the author do not provide personalized recommendations. The author makes no representations as to the accuracy, completeness, or suitability of this information. FXStreet and the author will not be liable for any errors, omissions or any losses, injuries or damages arising from this information and its display or use. Errors and omissions excepted.

The author and FXStreet are not registered investment advisors and nothing in this article is intended to be investment advice.

Recommended content


Recommended content

Editors’ Picks

EUR/USD pulls away from daily lows, stays below 1.1000

EUR/USD pulls away from daily lows, stays below 1.1000

EUR/USD stages a modest rebound from the daily low it set at 1.0950 on upbeat US data releases but remains below 1.1000 in the American session. The improving risk mood limits the US Dollar's gains and helps the pair find support.

EUR/USD News

GBP/USD rebounds to 1.2850 on improving risk mood

GBP/USD rebounds to 1.2850 on improving risk mood

GBP/USD regains its traction and trades marginally higher on the day near 1.2850. Although the pair came under bearish pressure after strong US data releases, it managed to reverse its direction with risk flows starting to dominate the action in financial markets.

GBP/USD News

Gold holds on to modest gains above $2,450

Gold holds on to modest gains above $2,450

Gold trades in positive territory above $2,450 in the American session on Thursday after dropping toward $2,430 with the immediate reaction to the stronger-than-forecast US data. The benchmark 10-year US yield is up more than 2% on the day above 3.9%, capping XAU/USD's upside.

Gold News

AAVE price eyes for rally after retest of support level

AAVE price eyes for rally after retest of support level

Aave (AAVE) price trades slightly higher during the Asian trading session on Thursday after surging on Wednesday. On-chain data shows that open interest, daily active addresses and development activity are rising, signaling a bullish trend.

Read more

Fed rate cut in September? The data will decide

Fed rate cut in September? The data will decide

The US economy is currently navigating a period of slowing growth, persistent inflation, and a tight labour market. The Fed's aggressive monetary policy tightening over the past year has started to show results in moderating inflation

Read more

Forex MAJORS

Cryptocurrencies

Signatures